
Maui has two rain shadows, one behind each of its mountains, and every resort coast sits inside one: Lāhainā and Kāʻanapali in the lee of the West Maui Mountains, Kīhei and Wailea behind Haleakalā. Kīhei gets 11.5 inches of rain a year; the windward slopes above Hāna catch more than 75. Temperature differs far less: Kīhei averages 74.9 F over a full year, Hāna 73.7.
December is the wettest month and June the driest, and beach-day odds peak in September on the west and south coasts. Sunrise at the summit of Haleakalā is regularly at or below freezing.
Table of contents
What is the best time to visit Maui?
For weather alone the answer is any month, on the right coast: Kīhei and Kāʻanapali stay warm and dry year-round, and the whole island’s sea-level temperature changes little across the year. Prices and crowds change far more through the year than the temperature does, and our full guide to the best time to visit Maui lists both month by month.
Hurricane season runs June through November, though a direct hit on Maui is rare. Our Hawaiian weather page covers the season in full.
Maui at a glance
At the coast, where most visitors stay, temperature changes little through the year. Inland and uphill it runs cooler:
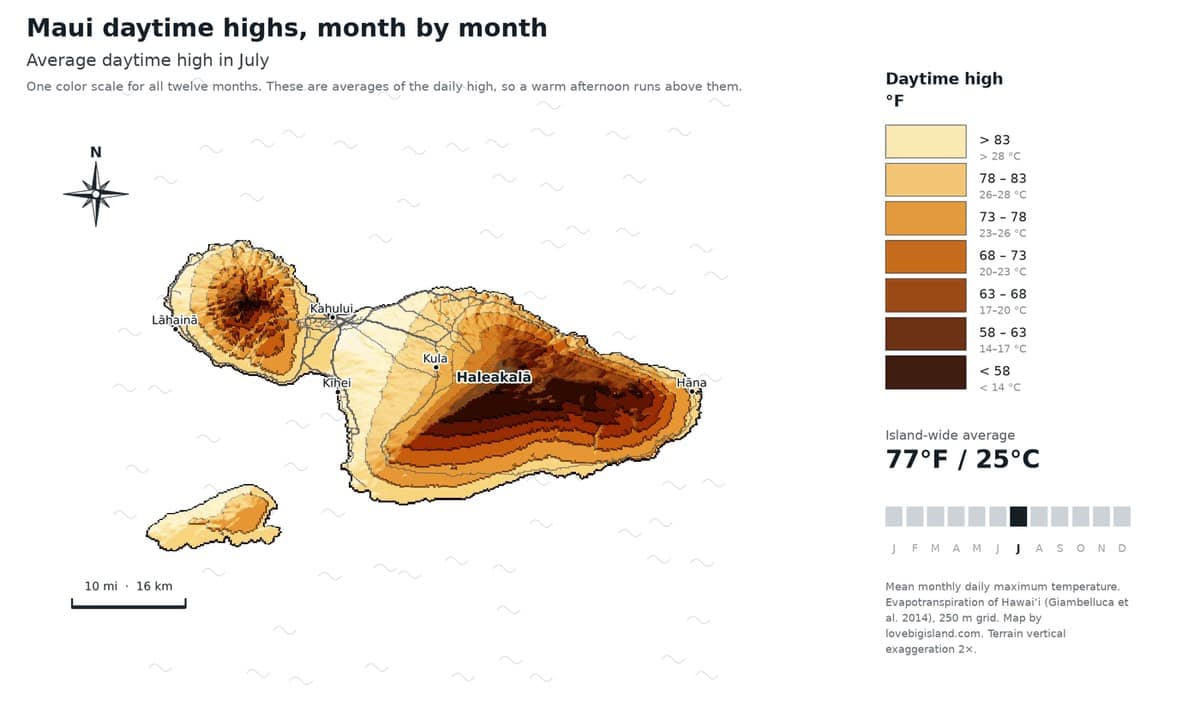
The fact sheet lists coast highs; the whole island is not so even. In July, the widest-spread month, the leeward coast tops 85°F while the Haleakalā summit holds the 50s, over thirty degrees apart on one afternoon. Averages of the daily high, one color scale for all twelve months. Data: Giambelluca et al. (2014), 250 m grid. Map by Love Big Island.
Month by month: temperature, rainfall, and cloud
Winter runs a little wetter and summer a little drier, but that swing is small next to the gap between the wet windward side and the dry leeward one. The sections here go month by month through temperature, rainfall, and cloud.
Maui has a wetter winter and a drier summer: island-wide monthly rainfall runs between 6.3 and 8.9 inches from November through April, peaking in March, and between 4.2 and 5.4 inches from May through October, bottoming out in June. That is a factor-of-two swing across the year, small next to the sixfold gap between Hāna and Kīhei.
The trade winds stop on more days in winter, and kona winds can replace them: southwest flows that push rain onto the coasts that stay dry the rest of the year. A wet day in Kīhei is almost always a kona day.
Daytime warmth barely changes through the year
At sea level the whole year spans about eight degrees. Kahului’s average high runs from 82 F in January to 90 F in September, its nights from 64 F to 72 F; Hāna, on the wet coast, is milder, 77 to 83 F. Ocean temperature is steadier still and lags the air by about a month: near 74 F in late winter, close to 80 F by early fall. September, not July, is the warm end of Maui’s year, and February the cool end.
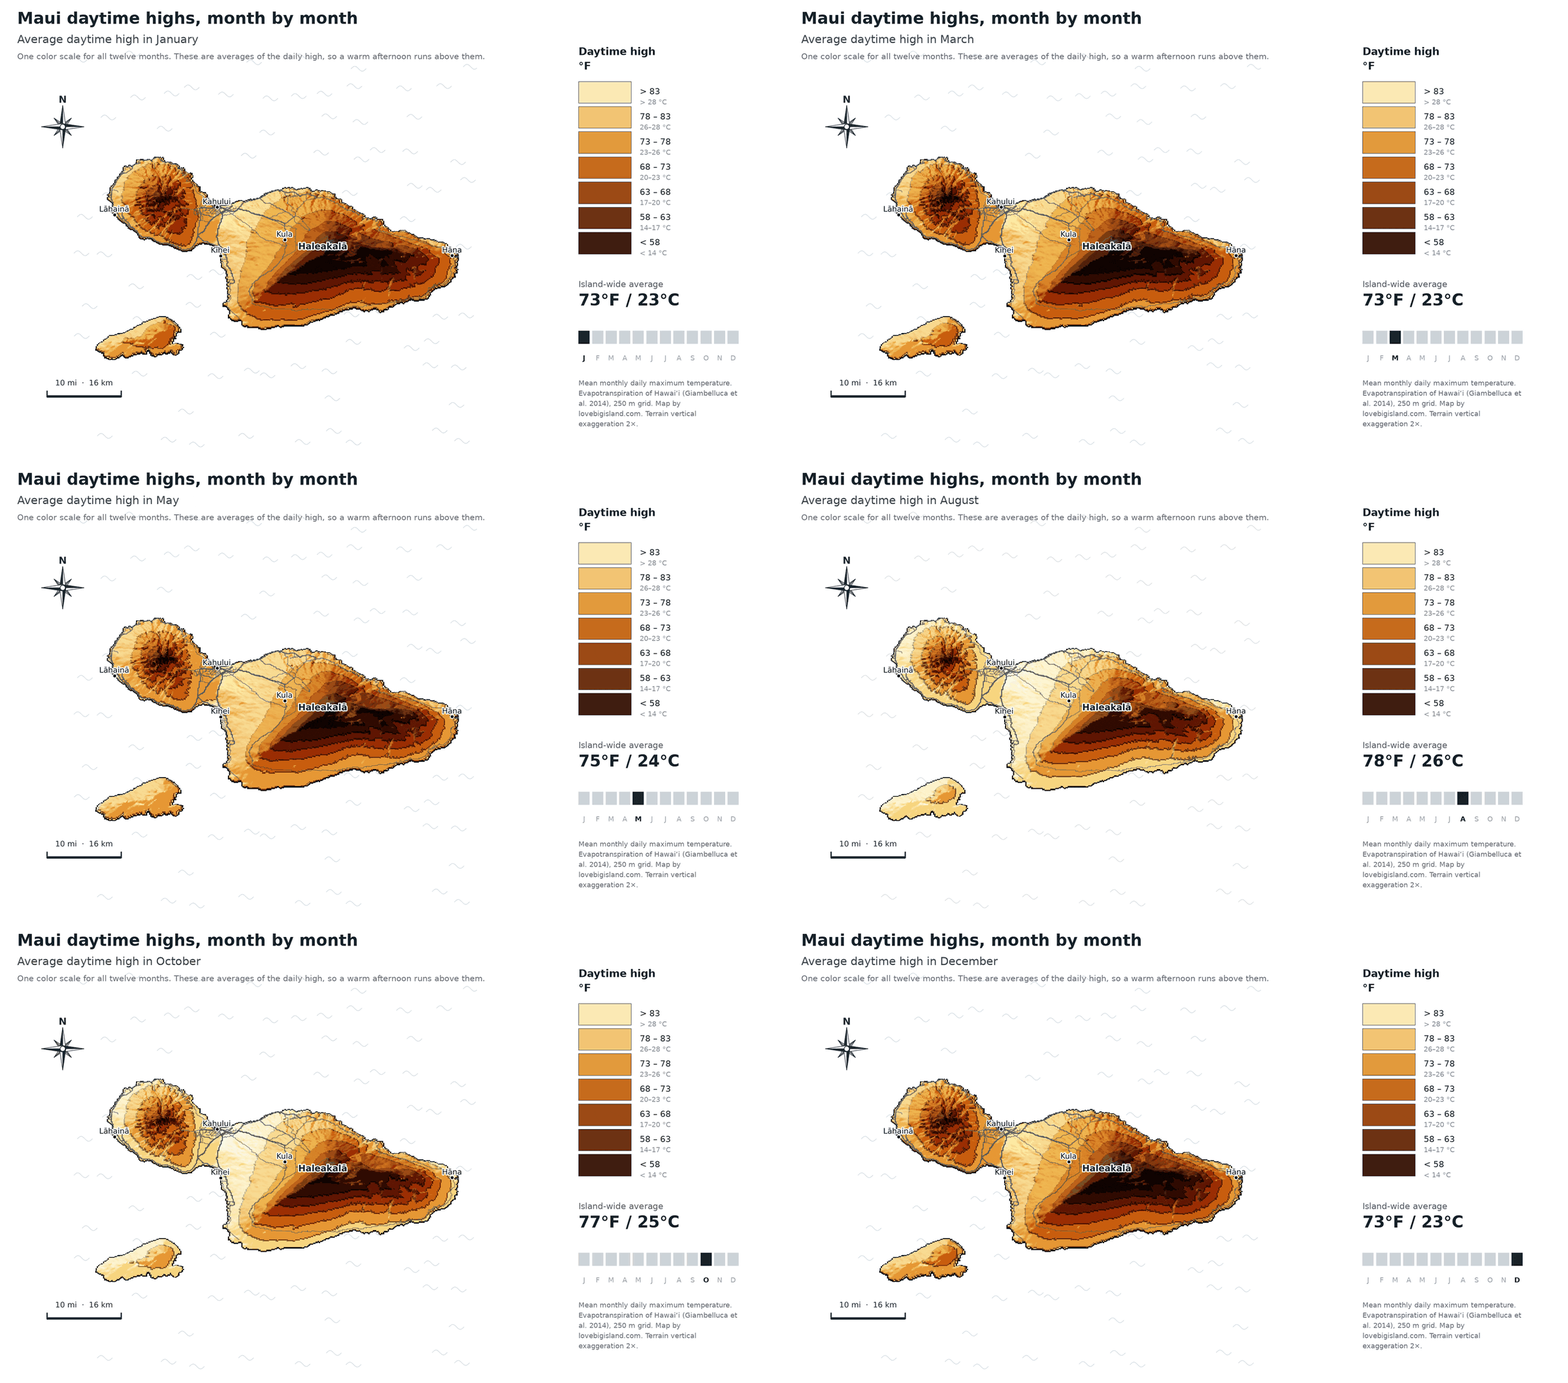
Average daytime high for each month, on one color scale for all twelve months. Island-wide, February is the coolest month at 72.3 F and September the warmest at 78.2. Those averages include the mountain; at sea level, Kahului’s normal highs run from 82.2 F in January to 90.0 F in September. Data: Giambelluca et al. (2014), 250 m grid. Map by Love Big Island.
The map averages the whole island, including the Haleakalā summit and the upcountry slopes, so its figures are cooler than the beach. The two coasts, month by month, are in the table.
| Month | Kahului high / low | Hāna high / low |
|---|---|---|
| January | 82 / 64 | 78 / 65 |
| February | 82 / 64 | 77 / 65 |
| March | 83 / 65 | 78 / 66 |
| April | 85 / 67 | 78 / 67 |
| May | 87 / 68 | 80 / 68 |
| June | 88 / 70 | 81 / 70 |
| July | 89 / 72 | 82 / 71 |
| August | 90 / 72 | 83 / 72 |
| September | 90 / 71 | 83 / 70 |
| October | 89 / 70 | 82 / 71 |
| November | 86 / 68 | 80 / 70 |
| December | 83 / 66 | 79 / 68 |
| Average daily high and low in °F, NOAA 1991-2020 normals. Kahului is Kahului Airport (USW00022516), Hāna is Hāna Airport (USC00511125). These are monthly averages, not records: a warm afternoon runs above the high column, a cool night below the low. | ||
Rainfall through the year
Even in the wettest months the heavy totals fall on the windward Haleakalā slopes while the Kīhei coast never tops three inches in any month.
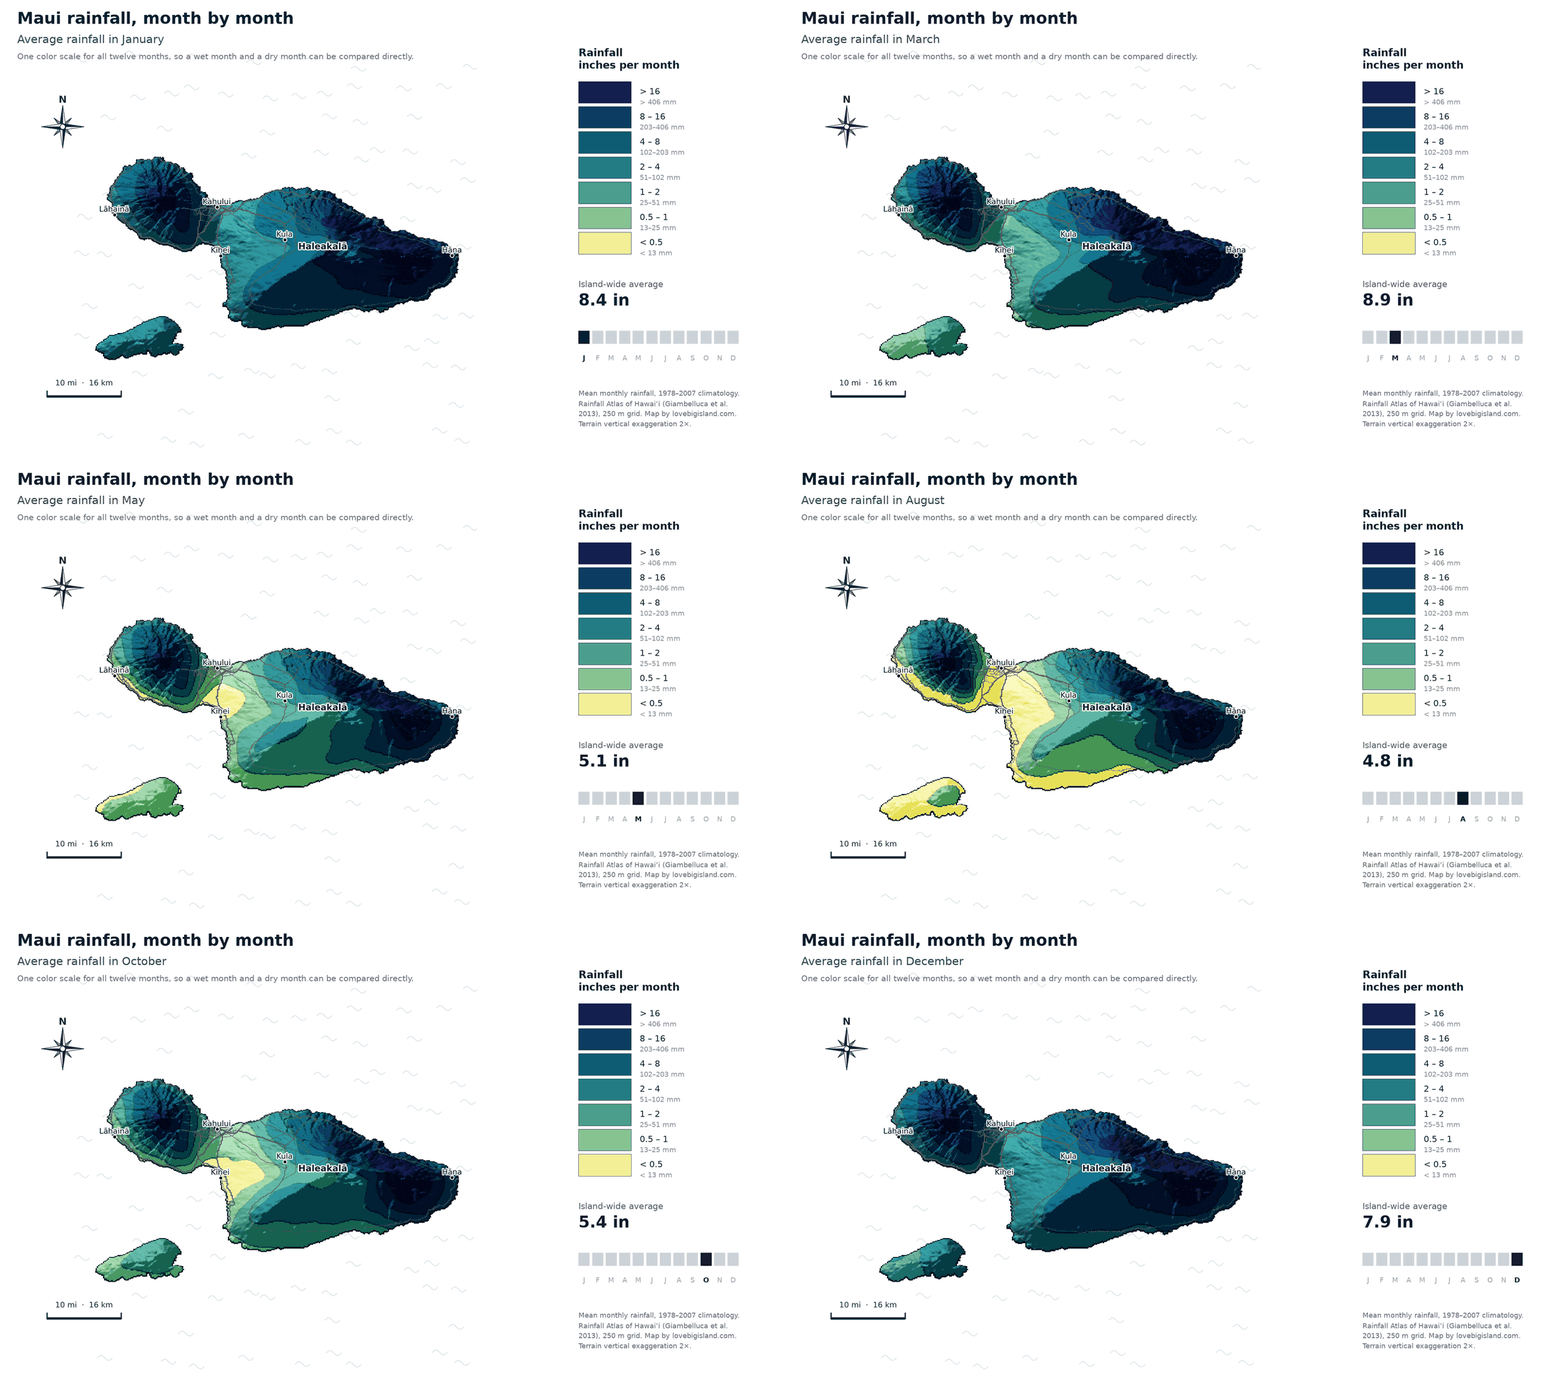
Average rainfall for each month, draped over Maui’s terrain. Every month uses the same color scale, so a wet month and a dry month can be compared directly. March averages 8.9 inches across the island, June 4.2. Data: Rainfall Atlas of Hawaiʻi (Giambelluca et al. 2013), 250 m grid. Map by Love Big Island.
Averaged over the whole island, Maui gets 8.9 inches in March, its wettest month, sliding to 4.2 inches in June, its driest, then climbing back through the fall. At the airport gauges, Kahului averages 16 inches of rain a year and Hāna 72, four and a half times as much. And most of it is light: Kahului sees rain on 95 days a year but reaches an inch on only four of them.
Where the rain lands, town by town, wettest to driest:
| Place | in / yr | mm / yr | Setting |
|---|---|---|---|
| Haʻikū | 69 | 1,750 | Windward, upcountry north |
| Hāna | 68 | 1,730 | Windward east coast |
| Makawao | 61 | 1,550 | Upcountry Haleakalā slope |
| Pāʻia | 33 | 840 | North shore |
| Wailuku | 29 | 740 | Base of the West Maui Mountains |
| Kāʻanapali | 18 | 460 | West-side resort coast |
| Kahului | 16 | 410 | Central isthmus (airport) |
| Lāhainā | 13.3 | 340 | West leeward town |
| Kīhei | 11.5 | 290 | South leeward resort coast |
Sunny skies and cloud cover
Cloud builds against the mountain slopes as the day heats up, so mornings are clearer on both sides of the island: schedule summit drives and windward sightseeing before noon when you can. The leeward coasts run clearer than the island average all year, with Kīhei near 39 percent daytime cloud.
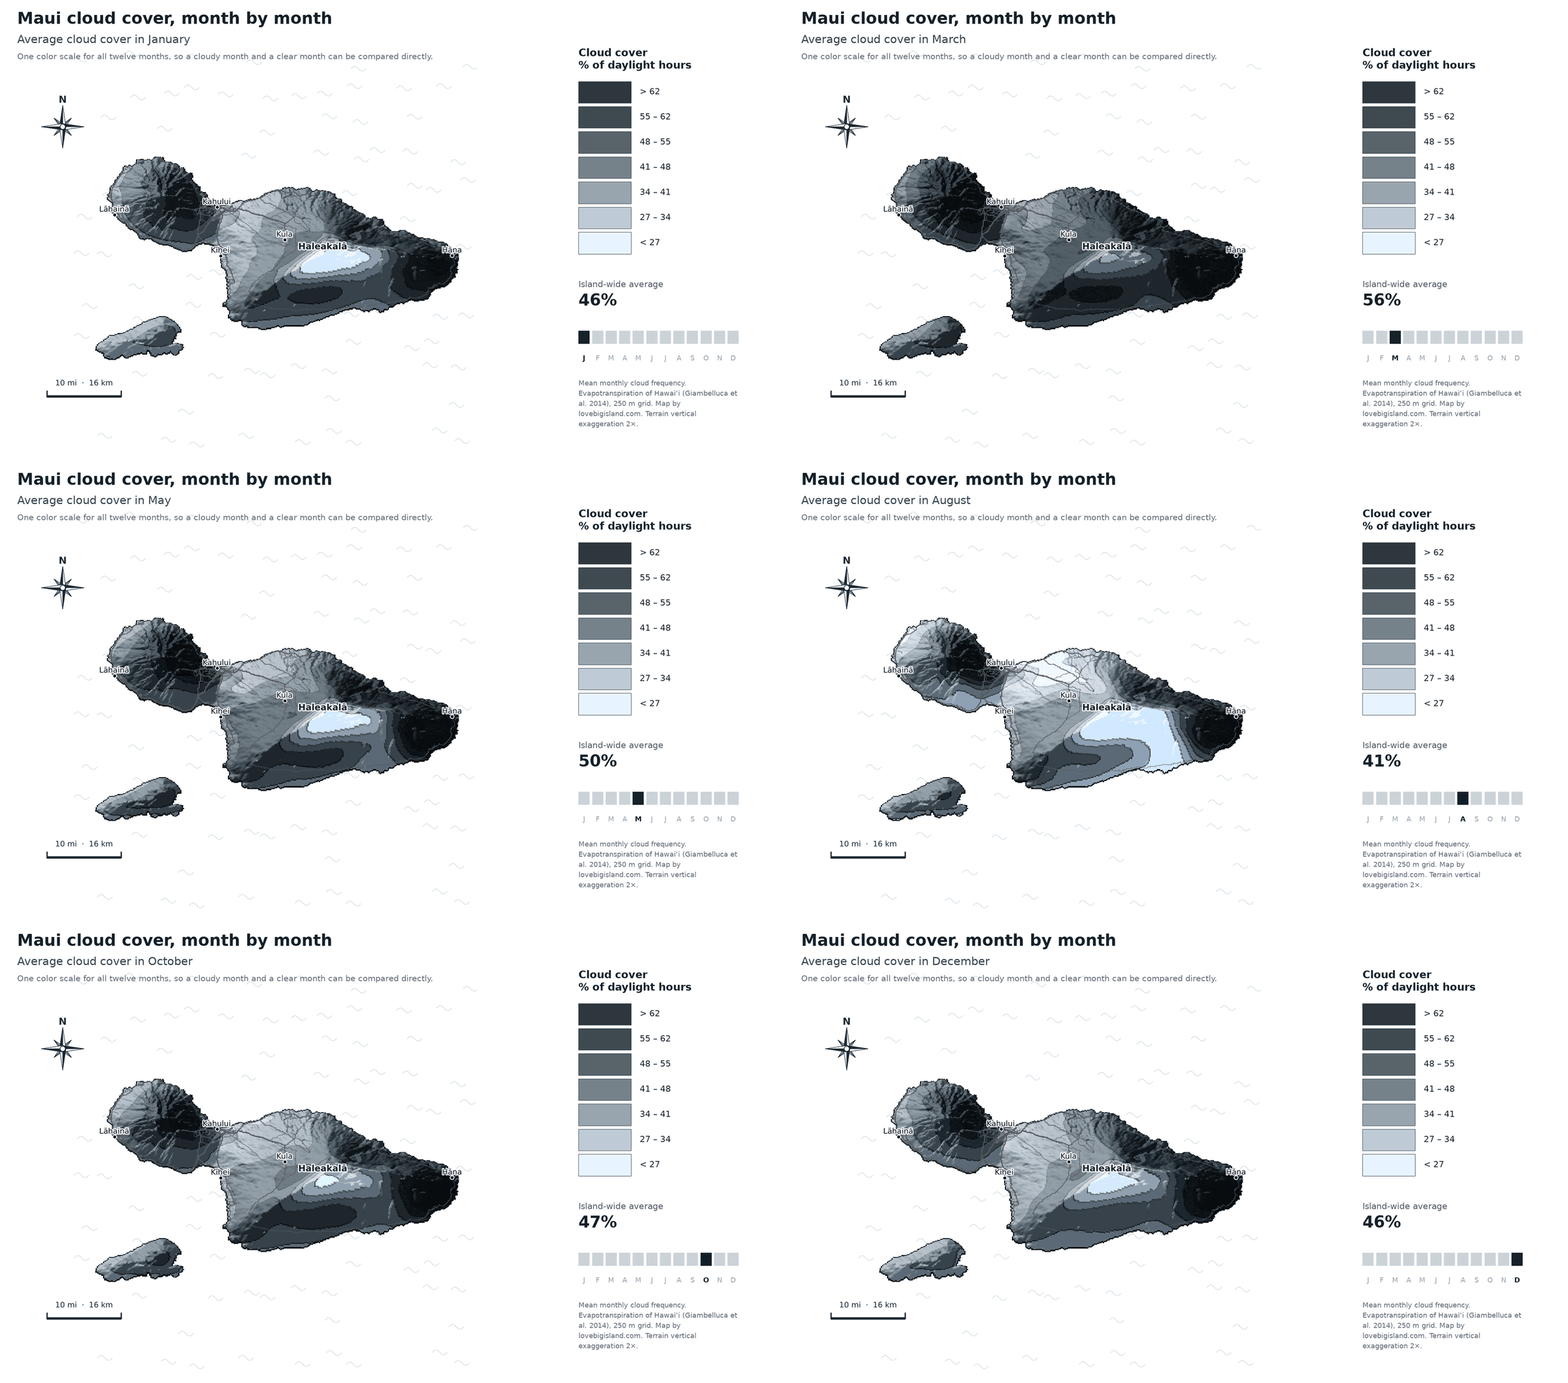
Average cloud cover during daylight hours for each month, on one color scale for all twelve months. March is the cloudiest month island-wide at 56 percent of daylight hours, September the clearest at 39. Data: Giambelluca et al. (2014), 250 m grid. Map by Love Big Island.
Across the year, March is the cloudiest month island-wide at 56 percent of daylight hours and September the clearest at 39. January and June sit at 46 percent, July at 44, August at 41.
How the trade winds shape local weather
The trade winds arrive from the northeast most of the time: on 80 to 95 percent of days in summer and 50 to 80 percent in winter. Moist ocean air rides up the windward slopes of Haleakalā and the West Maui Mountains, drops its rain on the way up, and slides down the leeward side dry.
With wet windward slopes a short drive from a dry leeward coast, Maui has 7 of the world’s 13 climate zones; we map where each sits in our guide to Maui’s climate zones. The same trades funnel between the two mountain masses and make the central valley windy, so the National Weather Service gives Māʻalaea Bay its own coastal-waters forecast: read that one before a boat trip out of Māʻalaea Harbor.
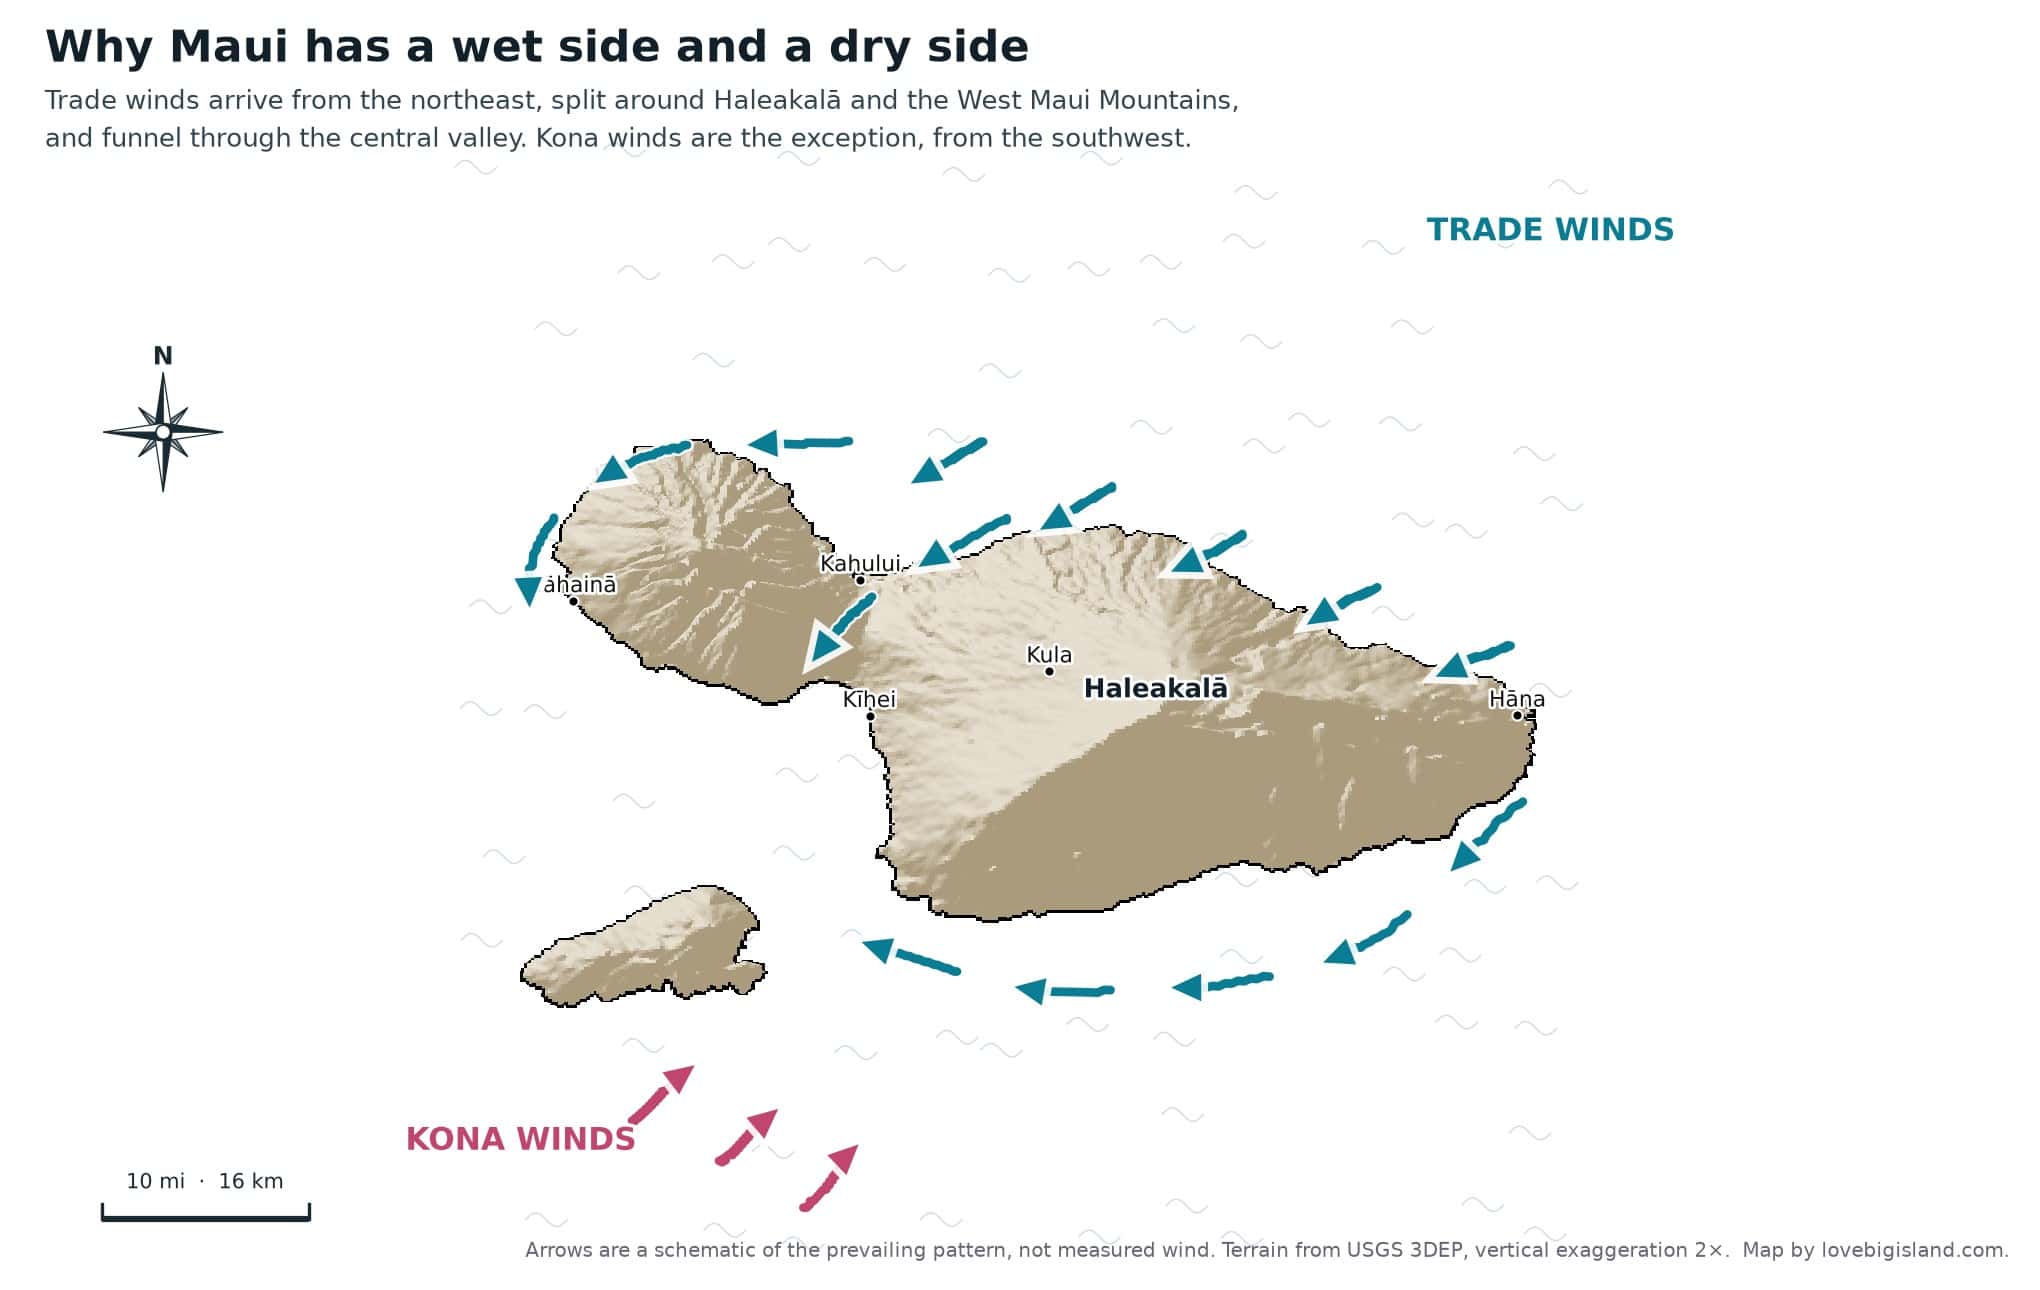
Trade winds arrive from the northeast, split around Haleakalā and the West Maui Mountains, and funnel through the central valley; kona winds are the rarer southwest exception. The arrows are a schematic of the prevailing pattern, not measured wind. Map by Love Big Island.
Hāna is on the windward coast, and Kīhei is in the lee behind the mountains.
The windward side catches the rain
Hāna, facing the trades head-on, averages 67.7 inches of rain a year under 64 percent daytime cloud. Expect showers on the Road to Hāna in any month. If rain settles in where you are staying, our guide to Maui rainy day activities covers what to do indoors and which outdoor plans to save for a clearer day.
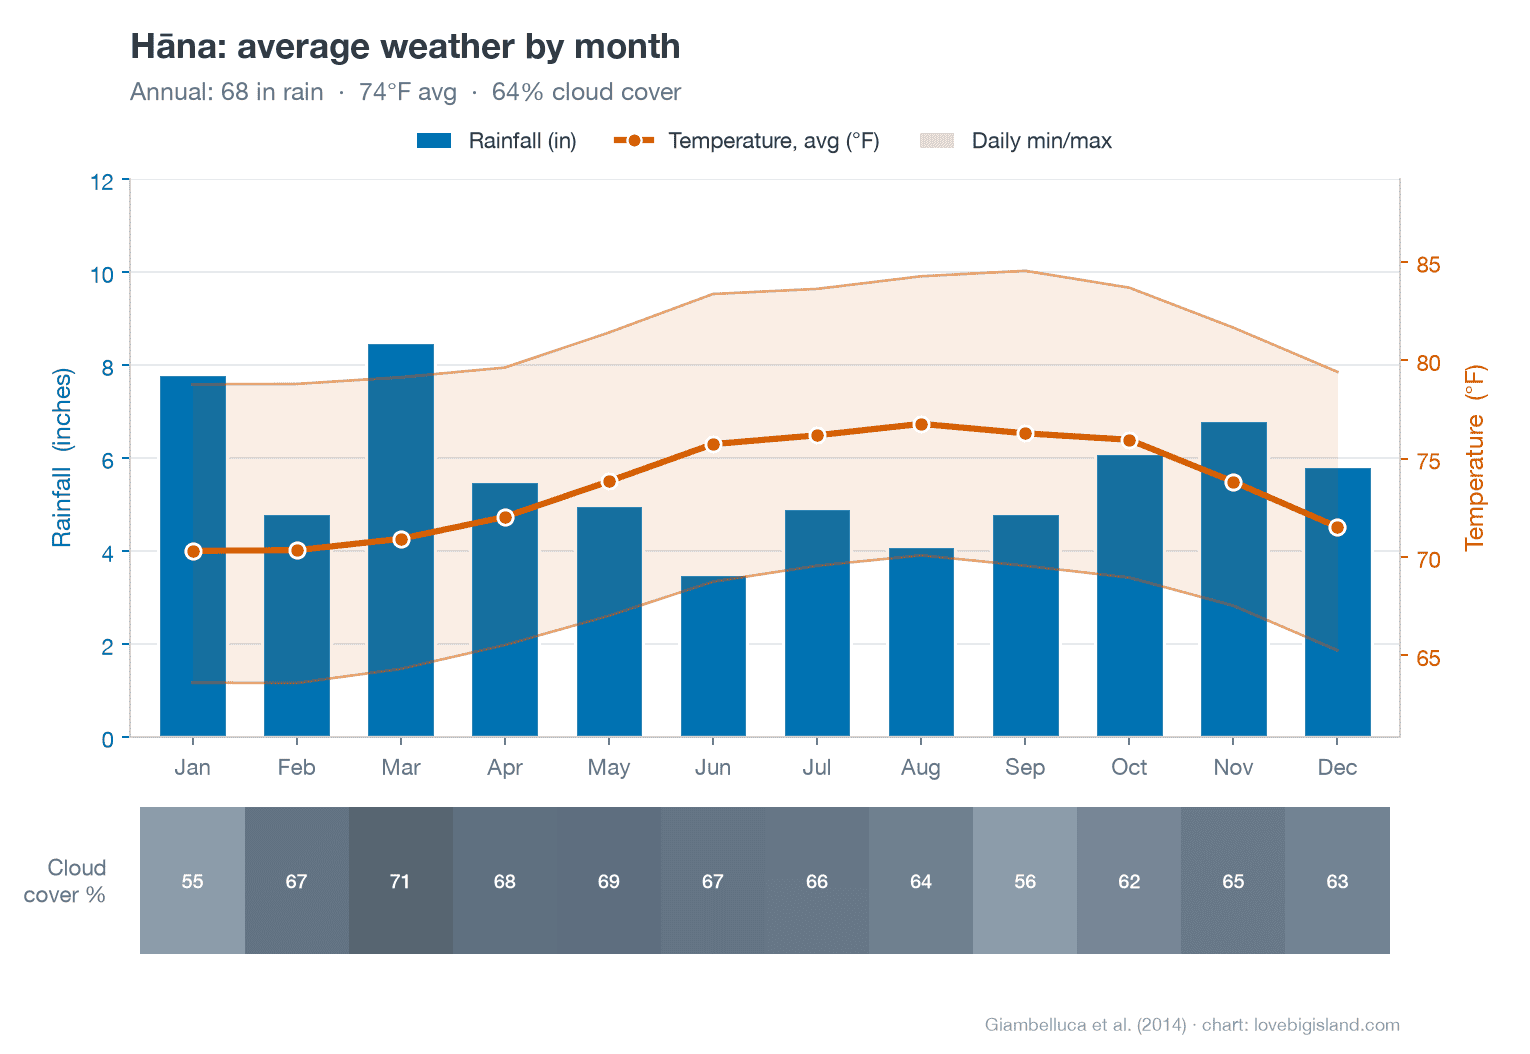
Hāna, the wet coast: 67.7 inches of rain a year under 64 percent daytime cloud. This chart and the Kīhei chart below share one rainfall scale, so the bars compare directly. Data: Giambelluca et al. (2013, 2014), 250 m grid. Chart by Love Big Island.
The leeward side sits in the rain shadow
Kīhei averages 11.5 inches of rain a year under 39 percent daytime cloud, and Lāhainā 13.3 inches under 40 percent. Kāʻanapali and Kīhei stay dry in almost every month. The exception is a kona wind, the southwest flow that briefly reverses the whole pattern and is the usual reason a leeward coast sees rain.
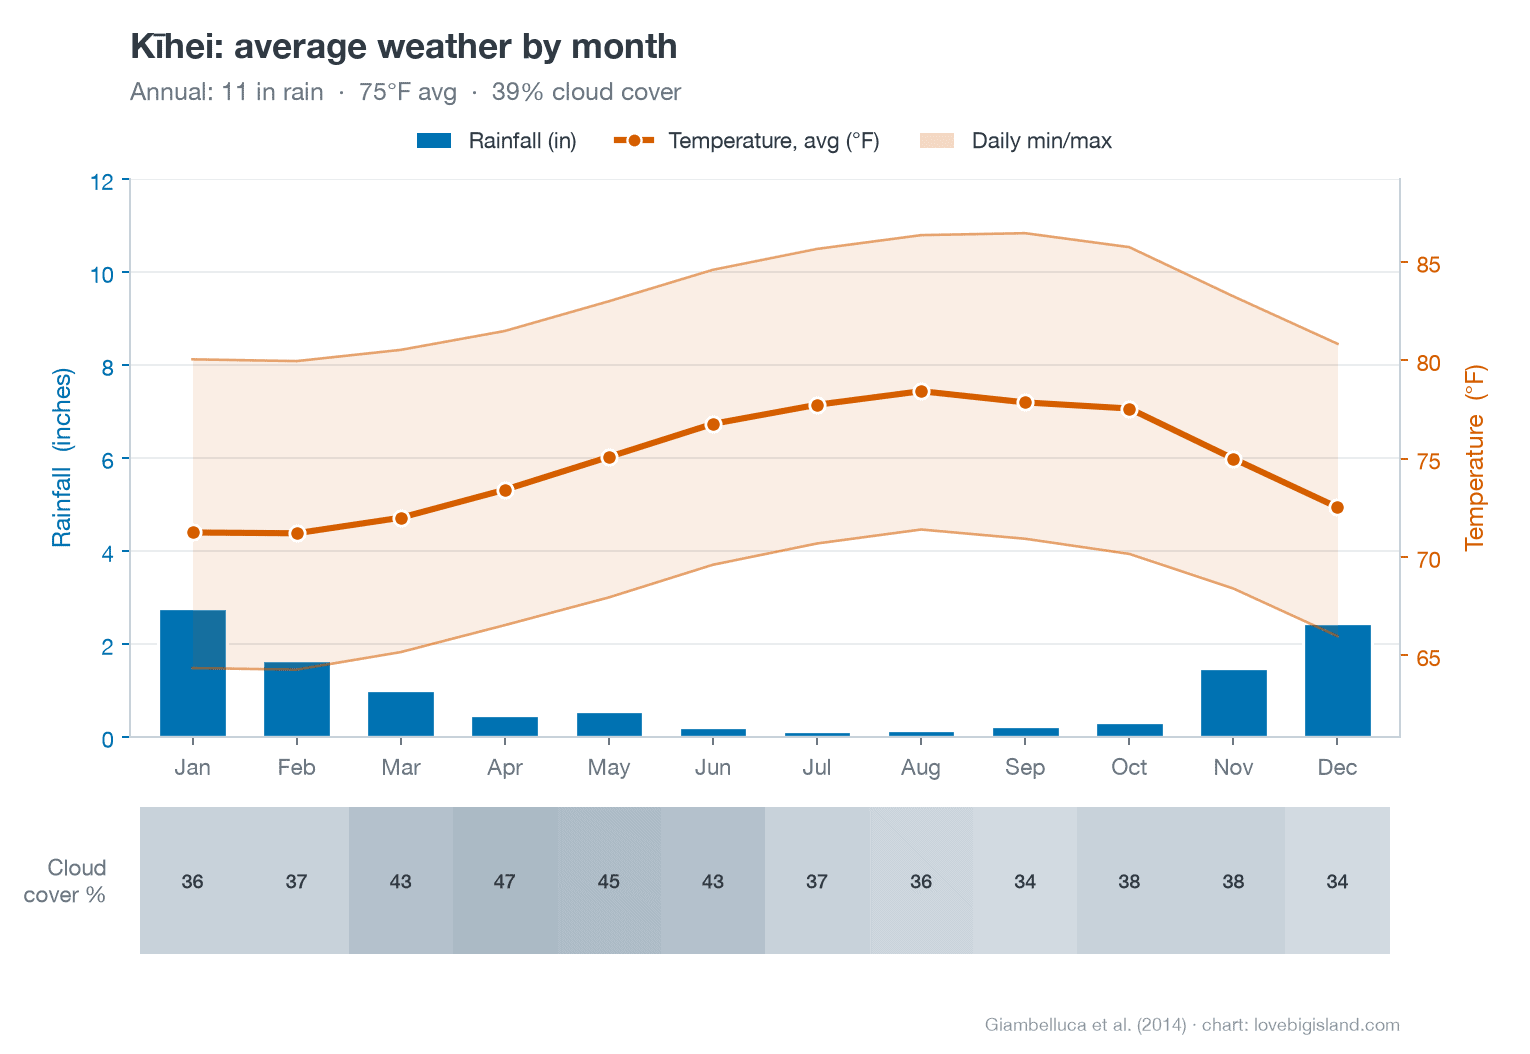
Kīhei, the dry coast: 11.5 inches of rain a year under 39 percent daytime cloud. On the shared scale the Kīhei bars barely clear the axis while the Hāna bars fill it, the same sixfold rainfall gap the page opens with. Data: Giambelluca et al. (2013, 2014), 250 m grid. Chart by Love Big Island.
Beach days and ocean conditions
Maui’s leeward side has the most beach days, dry and bright most of the year, while the windward side catches trade showers in every month. High surf and brown water can both spoil a swim on an otherwise sunny day, and neither shows up in a weather forecast.
Beach days
Maui’s beach weather changes more from coast to coast than from day to day. We rated eleven of its beaches.
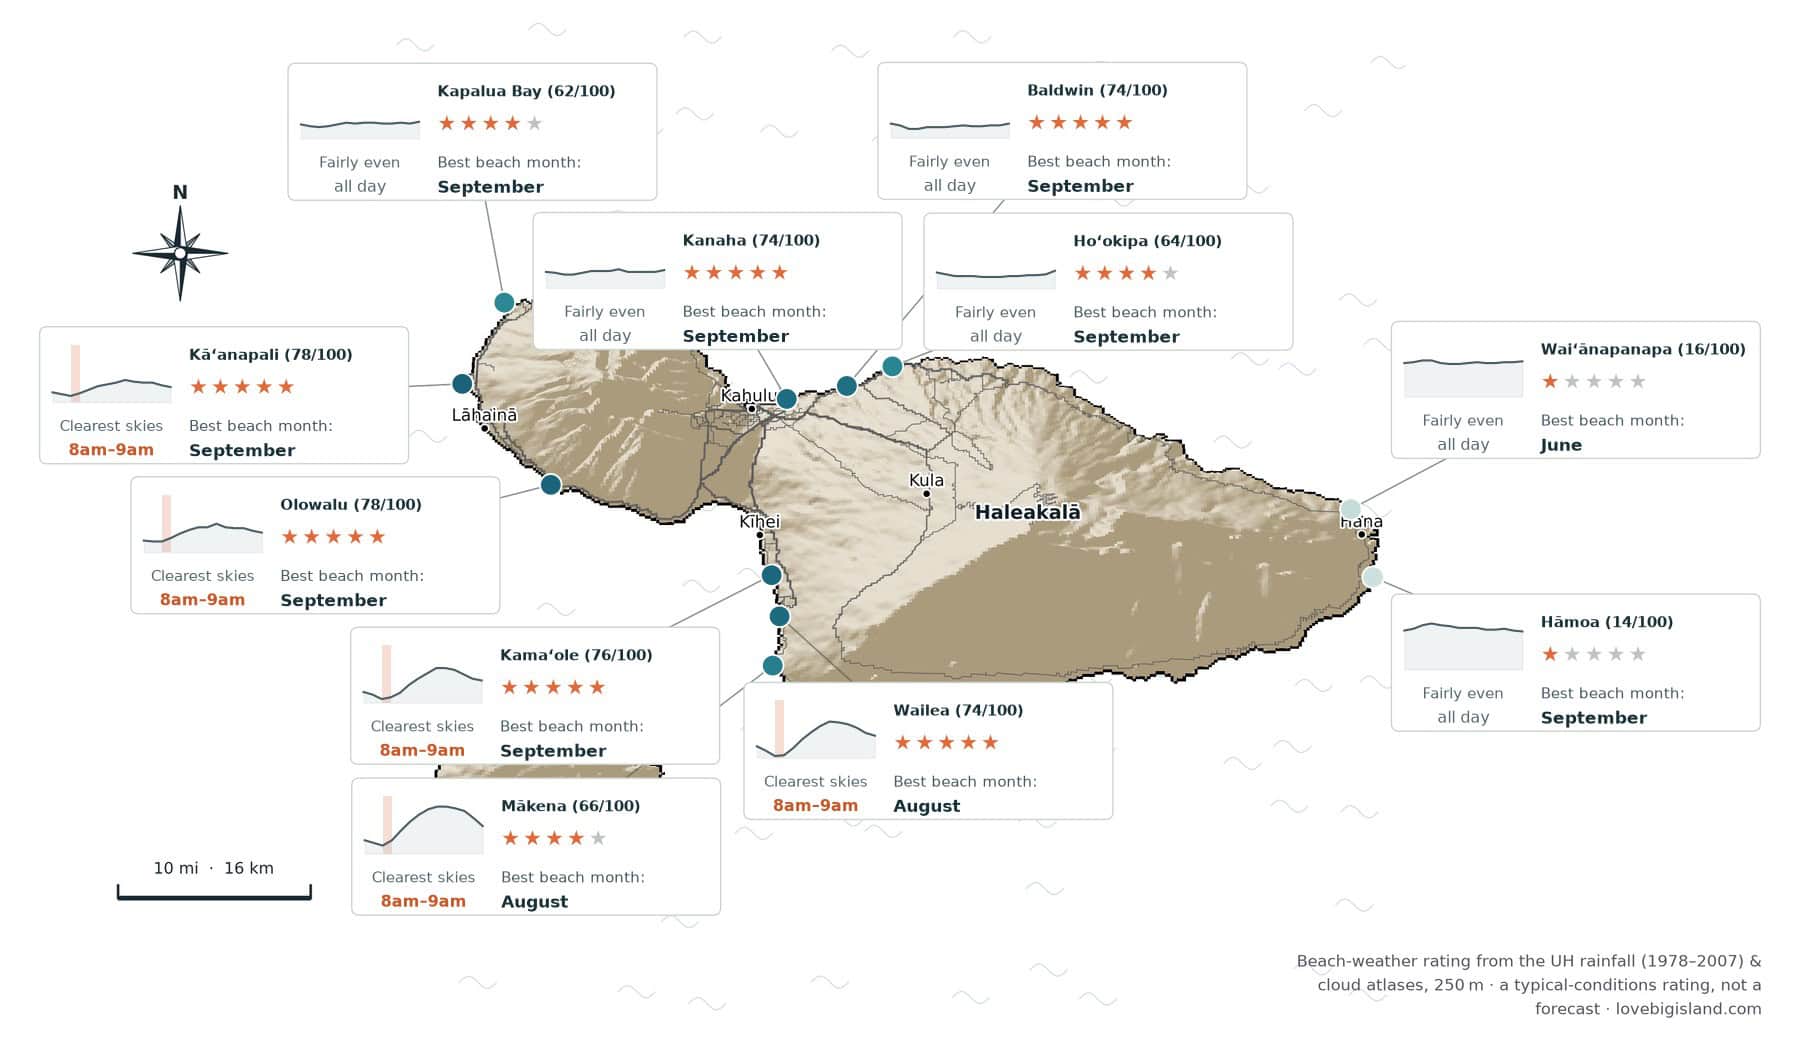
A beach-weather rating for eleven Maui beaches, deep blue for the best. Each card marks the beach’s score out of 100, the month it’s at its best, how cloudy a typical day runs hour by hour, and the clearest hours in orange (or fairly even all day where cloud barely shifts).
The leeward west and south coasts have the best beach weather: Kāʻanapali and Kapalua in the west, Kamaʻole, Wailea and Mākena in the south, all dry and often clear. The north-shore beaches by Kahului (Kanaha, Baldwin, Hoʻokipa) rate nearly as high but are windier. The Hāna-side beaches, Waiʻānapanapa and Hāmoa, are the wettest on the island by a wide margin. All that rain is why the Hāna side stays green. The clearest hours come in the morning on the leeward coasts.
How we rate the beach days
We rate each beach on how many good beach hours you can count on. The score comes from how much rain falls and how cloudy the sky is, averaged month by month over thirty years. The scores are relative, comparing these beaches with each other rather than promising sun on any day: a higher one means more dry, bright days over the year. The best month is the month that scores highest, when both rain and cloud bottom out.
The clearest hours come from a separate record of how cloudy it gets hour by hour through a typical day, so the best time to be on the sand is mornings on the leeward coasts, early afternoon on the windward side.
Brown water
Brown water is what runs off the land after heavy rain: storm runoff carrying pathogens from cesspools and septic tanks, animal waste from storm drains, sewage from overflowing manholes, and chemicals from paved runoff. It turns the nearshore water murky and brown, and the state’s brown-water advisory names Maui.
Stay out of brown water, and out of the streams feeding it, until it clears. The Hawaiʻi Department of Health sets no waiting period, so do not trust the common 48-hour figure; that number belongs to sewage and chemical spills, not storm water. Wait for the Department of Health to confirm the water is clear.
Check the Clean Water Branch’s map of current beach advisories for what’s posted where you’re staying.
Surf
North and west shores see surf over 25 feet many times each winter; south-facing shores top out around 10 to 15 feet in summer. A dry, sunny February week can still put 25-foot surf on the north and west coasts, so check the National Weather Service Hawaiʻi surf zone forecast for the specific shore you’re swimming off before you book anything in the water.
Haleakalā summit: the cold exception
Pack for cold at the summit of Haleakalā. Sunrise at the 10,023-foot summit is regularly at or below freezing once wind chill is counted, 30 or more degrees colder than the coast you left in the dark that morning.
Upcountry, evenings in Kula are cool enough for a sweater even in summer. For the summit itself, dress in the warmest layers you packed, cover your ears, and load the car the night before, because sunrise starts in the dark and the crater rim has no shelter from the wind.
Sources and methods
- Monthly temperature and station rainfall: NOAA 1991-2020 climate normals, Kahului Airport (USW00022516) and Hāna Airport (USC00511125). Hāna’s airport normal of 72.2 inches runs a little above the 67.7-inch atlas figure for Hāna town: a different gauge over a different period.
- Island rainfall, temperature and cloud maps: University of Hawaiʻi 250-meter grids: the Rainfall Atlas of Hawaiʻi (Giambelluca et al. 2013) for rainfall, and Giambelluca et al. (2014) for temperature and cloud.
- Beach-weather map: each beach rated on the UH 250-metre rainfall and cloud grids above, with the best time of day from the hour-by-hour cloud grid; base relief from the Terrarium DEM (SRTM/3DEP), roads © OpenStreetMap.
- Wettest and driest places: Rainfall Atlas station values, 1978-2007 base period.
- Ocean temperature: NWS Honolulu.
- Rain-day counts: Western Regional Climate Center period-of-record station summaries (0.01 inch or more; each station carries its own span of years).
- Trade-wind frequencies and the windy passes: the Hawaiʻi climate chapter Saul Price wrote for the 1983 Atlas of Hawaiʻi, now held by the WRCC. The trade-wind map is a hand-drawn schematic, not measured wind.
- Brown water and surf: Hawaiʻi Department of Health Clean Water Branch, and NWS Honolulu.
- Climate-zone count: our Maui climate zones guide.
- Haleakalā summit: National Park Service and NWS Honolulu.
- Drier-trend context: Abby Frazier in the 2023 National Climate Assessment, the University of Hawaiʻi’s 2025 annual climate report, and NWS Honolulu.
- Explore the data yourself: the UH Hawaiʻi Climate Data Portal publishes interactive climate maps, live readings from the Hawaiʻi Mesonet station network (live data), and monthly climate summaries.