
Poʻipū is the dry, sunny corner of Kauaʻi: about 41 inches of rain a year at the coast, and most of it falls as short showers that leave a quarter inch and move on. That is why so many of the island’s resorts and vacation rentals line this stretch of shore.
If you’re basing a Kauaʻi trip on the south shore for reliable beach weather, this page is the timing: when the rain backs off and when the surf comes up. That dry weather holds at the coast, though, not across the district. Drive the two miles inland to Kōloa for groceries and the yearly rain climbs by two thirds, over a road you’ll use most days you’re here.
Table of contents
- Best time to visit Poʻipū (and the at-a-glance cards)
- Poʻipū vs Kōloa: rain climbs 67% two miles inland
- Month-by-month temperature, rain, and cloud at the coast
- How often it rains: wet days across the year
- A typical day: hour-by-hour temperature and cloud
- Beach days and ocean conditions: summer surf and brown water
Best time to visit Poʻipū
Poʻipū works as a beach base all year. For the driest stretch, come between May and September: the coast collects barely two inches of rain a month and daytime highs reach the mid-80s. November through January is the wet season, though even then most days bring a short shower rather than a washout. Whale season runs December into March, right off these beaches.
Poʻipū at a glance
Each card jumps to the section that explains it.
Poʻipū vs Kōloa: rain climbs 67% two miles inland
Poʻipū is dry because it sits low and leeward, in the wind shadow of the mountains that fill the middle of Kauaʻi. That shelter is local, and it drops off fast. The coast at Kukuiʻula averages 40.63 inches of rain a year. Kōloa town, two miles inland and 240 feet up, averages 67.75.
That is 67% more rain over a drive you’ll make for groceries, about 13 inches a mile. Keep climbing to Kōloa Mauka at 640 feet and it reaches 87 inches, more than double the coast.
The University of Hawaiʻi rainfall atlas, which builds its numbers a different way, finds the same two-thirds jump between the two towns. So the single “Poʻipū rain number” you might want doesn’t exist: it depends on how far from the sand you’re standing. At the beach it’s dry; a few hundred feet uphill, less so.
You climb straight through this gradient any time you drive up to Waimea Canyon or over toward the north shore. Pack a layer, and expect rain on the windshield somewhere past Kōloa, even on a morning that started clear at the hotel.
Month by month at the coast: temperature, rain, and cloud
Temperatures barely move here. At Poʻipū’s atlas-grid point the coast runs from the high 70s by day in winter to the mid-80s in late summer, with nights in the mid-60s to low 70s. August and September are the warmest months, January and February the coolest. Rain is what changes: the wet season runs November through January, the dry stretch May through September.
Most forecasts for this area quote Līhuʻe Airport, on the windward side, and those numbers read a touch cool for Poʻipū: afternoons here run about 4°F warmer. Nights drop further too, a day-to-night swing of about 16°F against the airport’s 11°F.
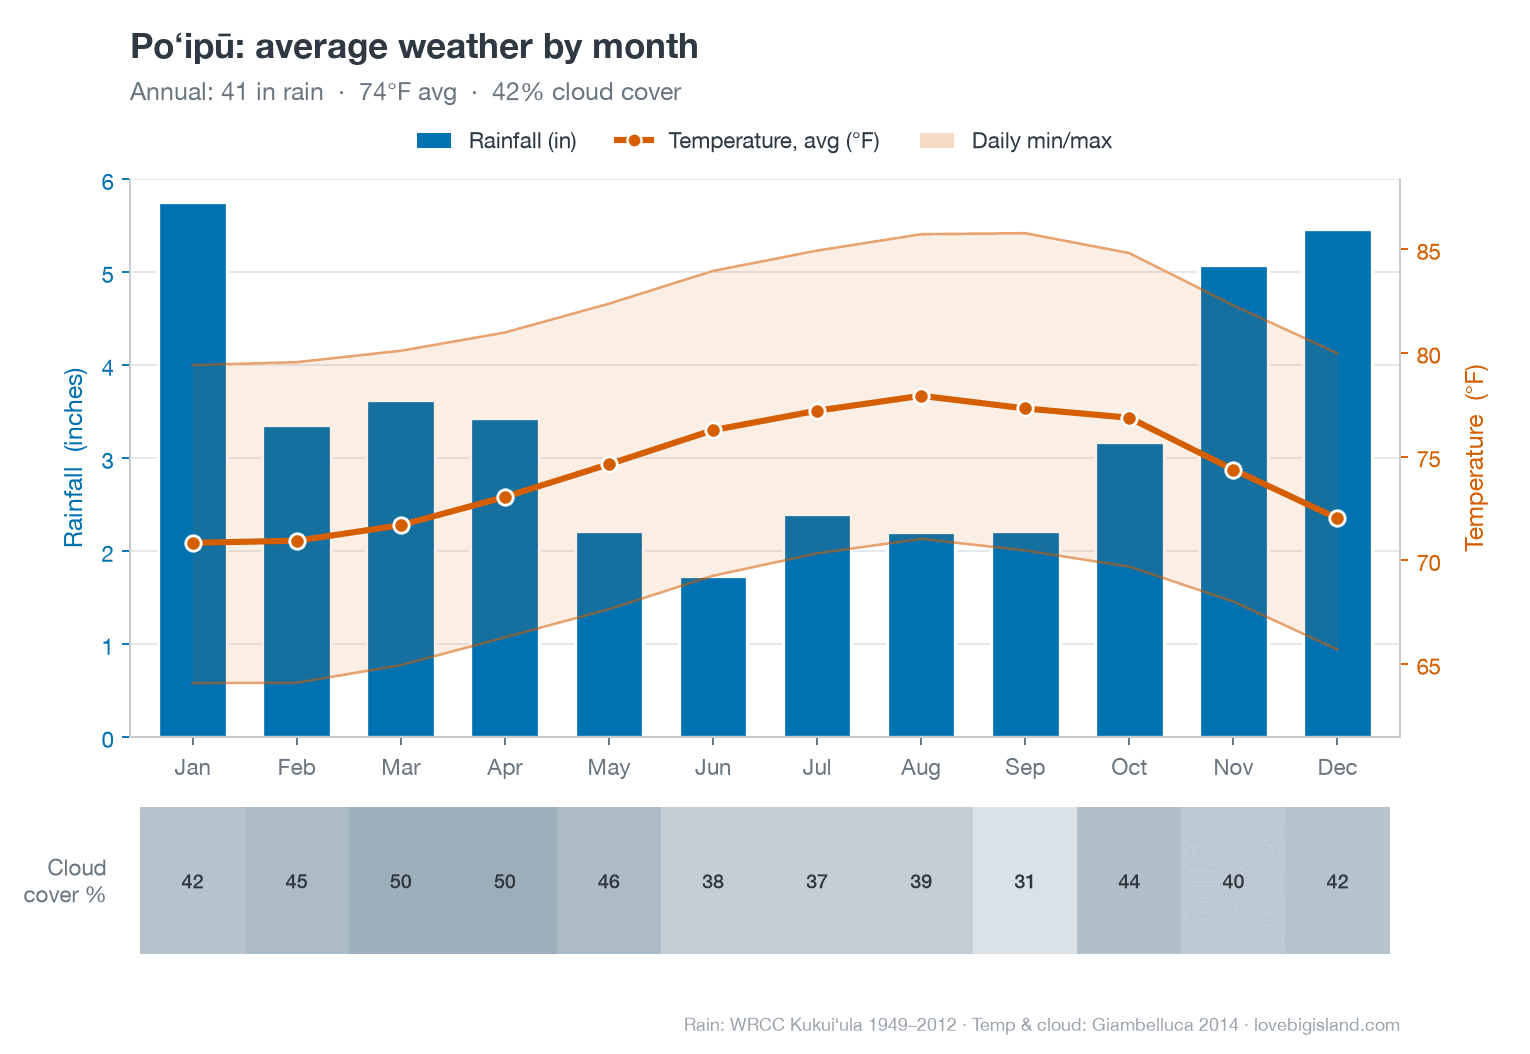
| Month | Temperature (°F) | Rainfall (in) | Cloud cover (%) |
|---|---|---|---|
| January | 79 / 64 | 5.75 | 42 |
| February | 80 / 64 | 3.36 | 45 |
| March | 80 / 65 | 3.62 | 50 |
| April | 81 / 66 | 3.43 | 50 |
| May | 82 / 68 | 2.22 | 46 |
| June | 84 / 69 | 1.73 | 38 |
| July | 85 / 70 | 2.40 | 37 |
| August | 86 / 71 | 2.20 | 39 |
| September | 86 / 70 | 2.22 | 31 |
| October | 85 / 70 | 3.17 | 44 |
| November | 82 / 68 | 5.08 | 40 |
| December | 80 / 66 | 5.46 | 42 |
| Annual | 82 / 68 | 40.64 | 42 |
Rainfall: Kukuiʻula gauge, WRCC period of record 1949–2012. Temperature and cloud cover: Poʻipū’s point in the UH 250 m atlas grid (Giambelluca et al. 2014), a gridded estimate.
How often it rains, and how hard
Poʻipū’s rain comes often and light. The coast records measurable rain on 163 days a year but collects only about 41 inches of it, a quarter inch per wet day, and more of those days land in July (17) than in January (13). Those summer showers are small: June through August together bring barely a sixth of the year’s rain. Only 18 days a year drop half an inch or more.
Dry leeward towns elsewhere in Hawaiʻi get their rain in a few big winter storms, sometimes half a year’s total in a single day. Poʻipū does not. Its wettest day on record dropped 7.43 inches, about 18% of the annual average, in February 2012. The rain here spreads thin across many small days instead of stacking into one flood, which is good news for a beach trip: a wet forecast usually means a passing shower, not a lost day. On the rare full wet day, our Kauaʻi rainy day activities guide covers the indoor options.
Hour by hour
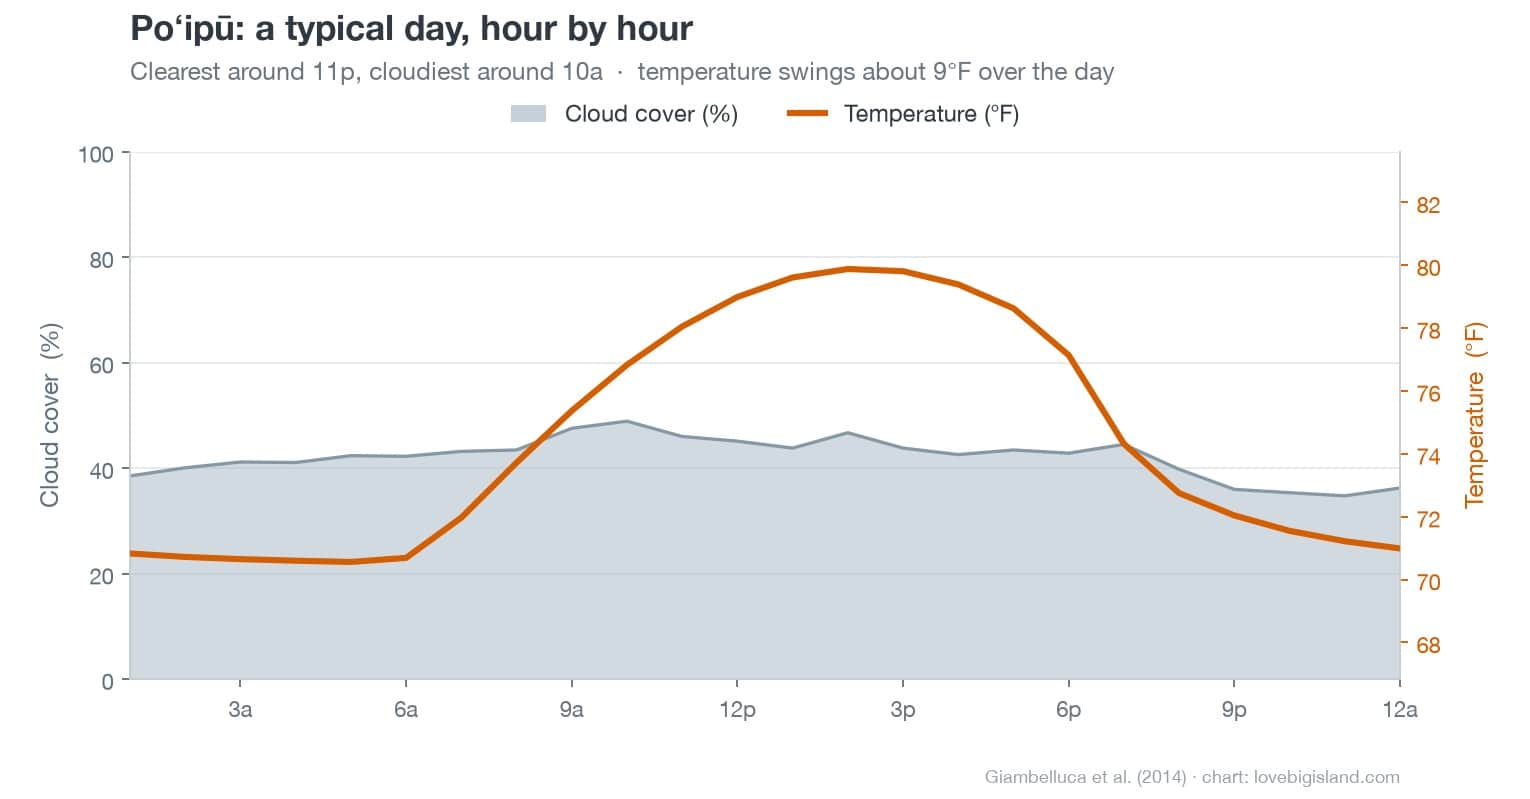
Poʻipū skips the strong clear-morning, cloudy-afternoon swing you get in some leeward Hawaiʻi towns. The atlas grid shows cloud cover fairly steady through the daylight hours here, a little under half the sky from morning into late afternoon, so no single beach hour is much sunnier than another. The clearest air comes in the evening. In practice, plan your beach time around the tide and the surf, not the hour of the day.
Beach days and ocean conditions
Poʻipū is the south shore’s main beach base, and it gets more sun than the windward and north shores. Two things still close the water on an otherwise sunny day: south swells in summer, and brown water after heavy rain on the mountains. Both are easy to check before you head to the sand.
On our Kauaʻi beach-weather map, Poʻipū Beach rates 4 of 5 stars, with September its best month, and its cloud cover barely shifts through the day, so morning and afternoon are equally good bets. The full per-beach map is on the Kauaʻi weather page.
Summer surf
The south shore faces the summer swell window. From about April to October, storms far to the south send swell onto these beaches, and Poʻipū’s surf can go from flat to overhead, meaning head-high or bigger, within a day. The town’s name points at this surf: poʻipū means water that “covers over” or “crashes,” and old accounts of neighboring Māhāʻulepū describe surf that “scours the sand off the shelves.” Check the National Weather Service south-facing surf forecast before you put children in the water, especially at open beaches like Māhāʻulepū and Shipwreck.
Brown water
Brown water is runoff: rain that washed off the land carrying loose soil and whatever else it crossed on the way down. It can turn the water at Poʻipū Beach cloudy under a blue sky, because the rain that caused it fell on the mountains you can see inland, not on the beach. The slopes that drain onto this coast run from 41 inches of rain a year at the sand to 87 at Kōloa Mauka and more than 370 at the summit of Waiʻaleʻale (WRCC period-of-record gauges), so a storm on the mountain reaches the beach through streams and drains even on a sunny day.
The state usually issues a brown-water advisory when the National Weather Service posts a flash-flood warning. The rule for a swimmer is simple: stay out of water that is cloudy, brown, or discolored until it clears, and there’s no fixed number of hours to wait. The “48 hours” figure repeated online is the state’s guidance for sewage spills, a different advisory; the storm-runoff guidance sets no time window at all.
Sources and methods
- Temperature and cloud (the temperature line and cloud strip on the climograph, the monthly table’s temperature and cloud columns, and the hour-by-hour chart): Poʻipū’s own point in the University of Hawaiʻi 250-metre atlas grid, from Giambelluca et al. (2014), Evapotranspiration of Hawaiʻi, via the Rainfall Atlas of Hawaiʻi. These are gridded estimates that interpolate between gauges.
- Rainfall (the climograph’s rain bars, the table’s rainfall column, rain-day counts, and the inland gradient): Western Regional Climate Center period-of-record gauge summaries, Kukuiʻula 935 and Kōloa 936, both 1949–2012. Three coastal gauges disagree by about 13% over different spans; this page uses Kukuiʻula, the longest coastal record, and names it.
- The day–night temperature swing and the warm-side comparison with the airport: NOAA 1991–2020 climate normals for Māhāʻulepū, the nearest station, 2.5 miles east of Poʻipū Beach, compared with Līhuʻe Airport. No 1991–2020 rainfall normal exists anywhere in Poʻipū or Kōloa.
- Surf and brown water: NWS Honolulu surf-zone forecast; Hawaiʻi Department of Health Clean Water Branch brown-water advisories.
- Beach-weather map (the Poʻipū Beach rating): each beach scored from 30-year monthly rainfall and cloud cover in the UH 250 m atlas grids. The full map is on the Kauaʻi weather hub.
- The town name: Place Names of Hawaiʻi (1974), Clark’s Hawaiʻi Place Names (2002), and the Pukui-Elbert Hawaiian Dictionary (1986), via Wehewehe Wikiwiki.
- Explore the data yourself: the UH Hawaiʻi Climate Data Portal publishes interactive climate maps, live readings from the Hawaiʻi Mesonet station network (live data), and monthly climate summaries.