Downtown Hilo collects 142 inches of rain a year. Downtown Kona gets 27, and the Waikoloa resort coast gets 9. Most of that rain falls at night. Hour-by-hour airport measurements from 2021 to 2024 put nearly a third of the year’s rain in the six hours after 6pm and only 16% in the six hours after noon, so the early afternoon is the drier half of the day, not the morning. That same rain is why the rainforest starts at the edge of town.
If you’re choosing between a Hilo base and the Kona side, the month matters. Air temperature sits near 70°F in winter and just over 75°F in late summer, so cloud cover is what varies: September is clearest at 55.2%, January close behind at 55.9%, and March through May all sit above 68%.
Table of contents
- Hilo weather on a month-by-month basis (January to December)
- A typical day in Hilo: average daily weather
- Hilo weather in a table: temperature, rainfall, and cloud cover throughout the year
For how the weather works across the whole of Hawaiʻi Island, start with our main weather guide:
Weather on the Big Island, Explained
Hilo gets 120 to 151 inches of rain a year, the Kohala coast under 10. Daytime highs sit in the high 70s to high 80s every month. Pick your side first.
Monthly average Hilo weather: temperature, rainfall and cloud cover
Average temperatures in Hilo run from 70°F in winter to just over 75°F in late summer (21 to 24°C). August is the warmest month at 75.4°F; January and February are the coolest, both close to 70°F. The whole year moves about 5°F, so what changes from month to month is the rain and the cloud, not the temperature.

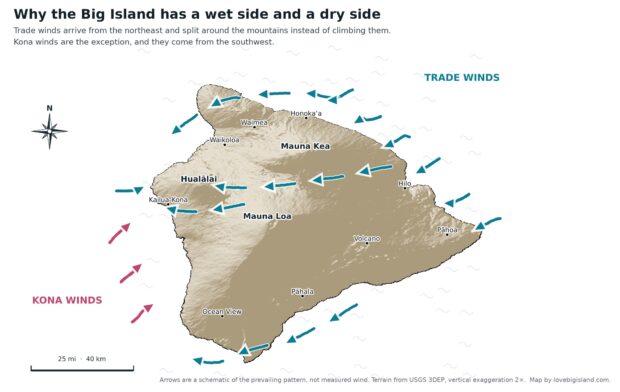
Hilo sits on the windward side of the Big Island, where the trade winds meet the slopes of Mauna Kea and Mauna Loa and drop their rain before it reaches the west coast. Downtown Kona and the Waikoloa resorts sit in the rain shadow behind those mountains, which is why they stay dry. Our island-wide weather guide maps how that split plays out across the island.
November is the wettest month at 16.7 inches, with March and April close behind. June is the driest at 8.5 inches, and even that is more rain than Kona sees in three average months, so bring a small umbrella whenever you come.
Cloud cover averages 63.6% across the year. March through May all sit above 68%, the cloudiest stretch on the calendar, while September and January come in near 56%.
Hourly average Hilo weather: air temperature and cloud cover
Cloud cover barely moves over the course of a day in Hilo, from about 60% at its thinnest to 66% at its thickest. The sun breaks through a little over a third of the time, and the best odds are early: the sky is clearest around 7a and cloudiest around 7p.

Air temperature moves about 7°F over a typical day, from close to 70°F just before dawn to about 77°F in the early afternoon. Direct sun makes it feel warmer than the number suggests, wind and rain cooler.
Hilo weather forecast
Everything on this page is a long-term average. Any given day in Hilo can land well off these numbers, and the rainfall is the figure that varies most.
For current conditions and the seven-day outlook, check the NOAA point forecast for Hilo.
Weather summary for downtown Hilo
If you want guaranteed sun, Hilo isn’t the town to base in. If you want the green side of the island, give it a couple of days in your itinerary and plan the outdoor hours for the early afternoon. The sky is clearest earlier in the day, but the afternoon is when the least rain falls.
| month | Temperature (°F) | Rainfall (in) | Cloud Frequency (%) |
|---|---|---|---|
| January | 70.18 | 10.28 | 55.87 |
| February | 70.04 | 10.34 | 65.85 |
| March | 70.35 | 15.03 | 70.36 |
| April | 71.27 | 14.15 | 72.31 |
| May | 72.97 | 9.73 | 68.17 |
| June | 74.24 | 8.53 | 65.65 |
| July | 74.97 | 11.95 | 60.67 |
| August | 75.38 | 11.33 | 59.64 |
| September | 75.31 | 11.31 | 55.20 |
| October | 75.20 | 11.01 | 63.14 |
| November | 73.07 | 16.71 | 63.94 |
| December | 70.76 | 11.73 | 61.99 |
| Annual | 72.81 | 142.09 | 63.57 |
Sources
All tables and figures on this page were created by Love Big Island using data from Giambelluca, T.W., X. Shuai, M.L. Barnes, R.J. Alliss, R.J. Longman, T. Miura, Q. Chen, A.G. Frazier, R.G. Mudd, L. Cuo, and A.D. Businger. 2014. Evapotranspiration of Hawaiʻi. Final report submitted to the U.S. Army Corps of Engineers, Honolulu District, and the Commission on Water Resource Management, State of Hawaiʻi.
We downloaded the data from the Rainfall Atlas of Hawaiʻi, the University of Hawaiʻi project that now hosts the evapotranspiration atlas for the main Hawaiian Islands.