Nine inches of rain a year. That is the whole annual total on the Waikoloa resort coast, the driest of the five Big Island towns we chart, with eight of the twelve months coming in under an inch. Highs run 80 to 86°F and lows 64 to 71°F.
These are the sea-level resorts: Waikoloa Beach Resort, the Hilton, Mauna Lani, the Fairmont Orchid. The inland town of Waikoloa Village sits six miles upslope at about 900 feet, and none of these numbers describe it. Even on this coast the sky fills in most afternoons, from about 23% cloud at 8am to 57% by 3pm, so take the beach and the boat trips in the morning.
Table of contents
- Waikoloa monthly weather (January to December)
- A typical day in Waikoloa: average daily weather
- Waikoloa weather summary in a table: temperature, rainfall, and cloud cover throughout the year
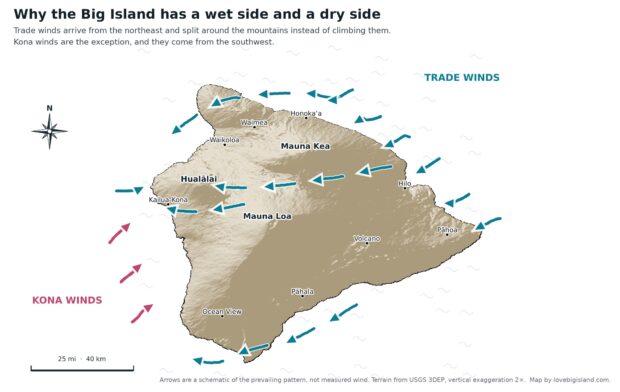
This coast is dry because it sits in the rain shadow of Mauna Kea and the Kohala mountains, which pull the moisture out of the trade winds before they reach the west side. Our guide to the island’s climate zones puts this stretch of shoreline in the desert zone.
For how the weather works across the whole of Hawaiʻi Island, start with our main weather guide:
Weather on the Big Island, Explained
Hilo gets 120 to 151 inches of rain a year, the Kohala coast under 10. Daytime highs sit in the high 70s to high 80s every month. Pick your side first.
Monthly average Waikoloa weather: temperature, rainfall and cloud cover
Monthly average temperatures on the resort coast run from 71°F (22°C) in January and February to 78°F (26°C) in August. That is a seven-degree spread across the entire year.

Those are whole-day averages, which understate the afternoon. A typical day moves about 15°F between its coolest hour and its warmest.
Rain is rare here: eight of the twelve months average under an inch, and the year totals 9 inches. Compare that with 27 inches in downtown Kona, 37 in Waimea, 122 in Volcano Village and 142 in Hilo. July is the driest month at a quarter of an inch, January the wettest at 1.7.
Cloud cover is the one thing here that swings by season. March and April sit near 43%, August and September near 25%.
Hourly average Waikoloa weather: air temperature and cloud cover
Cloud cover swings hard across a single day on this coast. It bottoms out near 23% around 8am, then builds through the middle of the day and peaks near 57% at 3pm and 4pm.
Even at that afternoon peak the sky is clear about 43% of the time. Over the full year this coast averages 34% cloud cover, against 45% at Waimea and 64% at Hilo.

Air temperature tracks the same shape, from about 71°F (22°C) before dawn to 80°F (27°C) in the early afternoon. That is the hourly average across all days, a few degrees under the average daily high. Direct sun on this coast makes it feel warmer again.
Waikoloa resorts weather forecast
Everything on this page is a long-term average. Any given day can land well off these numbers.
For the seven-day outlook, check the NOAA point forecast for the resort coast. Two things to know before you land on it: the forecast point is labelled Puakō, the shoreline just north of the Waikoloa resorts, and its current-conditions box reports from Kona airport about 15 miles south.
Yearly weather summary for Waikoloa and the north Kona resort coast
Of the five Big Island towns we chart, this coast is the driest and the least cloudy, and its annual average temperature is 75°F. More than half the year’s rain falls between December and March; April through November each average under an inch.
| month | Temperature (°F) | Rainfall (in) | Cloud Frequency (%) |
|---|---|---|---|
| January | 71.17 | 1.7199 | 31.83 |
| February | 71.17 | 1.0001 | 35.30 |
| March | 71.94 | 1.1510 | 42.54 |
| April | 73.38 | 0.5321 | 43.86 |
| May | 74.94 | 0.6087 | 39.71 |
| June | 76.65 | 0.3327 | 36.94 |
| July | 77.60 | 0.2477 | 29.89 |
| August | 78.29 | 0.3039 | 25.42 |
| September | 77.76 | 0.4074 | 26.02 |
| October | 77.38 | 0.4690 | 33.59 |
| November | 74.90 | 0.8353 | 34.19 |
| December | 72.55 | 1.3944 | 32.57 |
| Annual | 74.81 | 9.0023 | 34.32 |
Sources
All tables and figures on this page were created by Love Big Island using data from Giambelluca, T.W., X. Shuai, M.L. Barnes, R.J. Alliss, R.J. Longman, T. Miura, Q. Chen, A.G. Frazier, R.G. Mudd, L. Cuo, and A.D. Businger. 2014. Evapotranspiration of Hawaiʻi. Final report submitted to the U.S. Army Corps of Engineers, Honolulu District, and the Commission on Water Resource Management, State of Hawaiʻi.
We downloaded the data from the Rainfall Atlas of Hawaiʻi, the University of Hawaiʻi project that now hosts the evapotranspiration atlas for the main Hawaiian Islands.