
Cloud cover over Waimea averages about 30% through the night and about 70% in the middle of the day. It bottoms out near 28% around 11pm and peaks near 74% around 3pm. The town sits at 2,676 feet between the Kohala mountains and Mauna Kea, and averages 65°F and 37 inches of rain a year.
If you’re staying in Waimea or driving up from the Waikoloa coast, pack a layer. Nights run 54 to 61°F while days reach 71 to 77°F, about 16 degrees of swing and the widest of the five Big Island towns we chart. September is both the clearest and the driest month here, January the wettest at 4.9 inches.
Table of contents
- Waimea weather on a month-by-month basis (January to December)
- A typical day in Waimea: average daily weather
- Waimea weather summary in a table: temperature, rainfall, and cloud cover throughout the year
Waimea, also called Kamuela, sits on the boundary between the wet Hāmākua coast and the dry north Kona resort coast. At 2,676 feet (815 m) it runs cooler than any of the other four towns we chart except Volcano Village. Read more about the town itself on our Waimea page.
For how the weather works across the whole of Hawaiʻi Island, start with our main weather guide:
Weather on the Big Island, Explained
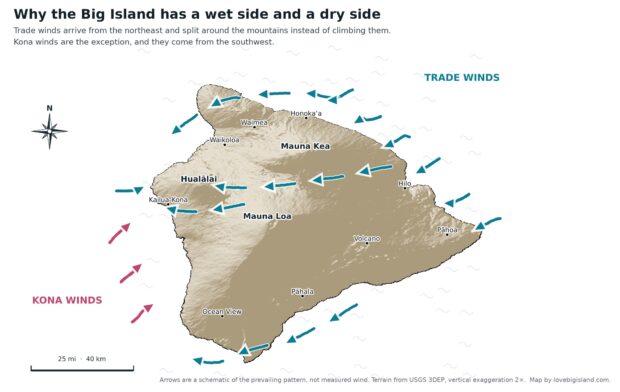
Hilo gets 120 to 151 inches of rain a year, the Kohala coast under 10. Daytime highs sit in the high 70s to high 80s every month. Pick your side first.
Monthly average Waimea weather: temperature, rainfall and cloud cover
Monthly average temperatures in Waimea run from 62°F (17°C) in February to 68°F (20°C) in August, with September and October just behind August.

Those are whole-day averages, and they hide a 16°F swing. The average daily high runs 71 to 77°F and the average daily low 54 to 61°F. That’s the widest day-to-night spread of the five towns we chart. Bring a sweater for the evenings.
Waimea gets 37 inches of rain a year, more than downtown Kona at 27 inches and far more than the Waikoloa resorts at 9, though well short of Hilo at 142. January is the wettest month at 4.9 inches. Cloud cover averages 45% across the year, cloudiest in March at 56%. September is the clearest month and the driest one at the same time, at 34% and 1.5 inches.
Hourly average Waimea weather: air temperature and cloud cover
Cloud cover sits near 30% through the small hours, starts climbing after sunrise, and peaks near 74% around 3pm before falling away again in the evening.
The sky over town is about two and a half times as cloudy at 3pm as it is at 11pm. Nights are usually clear, so the nights are good for stargazing.

Air temperature follows the same curve, from about 61°F before dawn to 71°F in the early afternoon. That is the hourly average across all days, so it sits inside the wider daily high and low above.
Waimea weather forecast
Everything on this page is a long-term average. Any given day in Waimea can differ a lot from these averages.
For the seven-day outlook, check the NOAA point forecast for Waimea, which NOAA places at 2,762 feet, a little above the town itself. Its current-conditions box reports from Bradshaw Army Air Field, which sits on the Saddle at 6,138 feet, about 20 miles away and some 3,400 feet higher, so those readings run much colder than town.
Weather summary for Waimea
Of the five Big Island towns we chart, Waimea is the second coolest after Volcano Village and the second least cloudy after the Waikoloa resort coast. Only two of the five get less rain: Waikoloa at 9 inches and Kona at 27.
| month | Temperature (°F) | Rainfall (in) | Cloud Frequency (%) |
|---|---|---|---|
| January | 61.91 | 4.922 | 42.07 |
| February | 61.66 | 3.326 | 50.49 |
| March | 62.39 | 4.164 | 56.34 |
| April | 63.64 | 3.726 | 52.93 |
| May | 65.01 | 2.787 | 47.03 |
| June | 67.09 | 2.002 | 44.99 |
| July | 67.49 | 3.137 | 41.49 |
| August | 68.21 | 2.180 | 38.63 |
| September | 67.89 | 1.450 | 34.29 |
| October | 67.56 | 1.922 | 43.97 |
| November | 65.32 | 3.422 | 45.16 |
| December | 63.03 | 3.770 | 43.62 |
| Annual | 65.10 | 36.807 | 45.08 |
Sources
All tables and figures on this page were created by Love Big Island using data from Giambelluca, T.W., X. Shuai, M.L. Barnes, R.J. Alliss, R.J. Longman, T. Miura, Q. Chen, A.G. Frazier, R.G. Mudd, L. Cuo, and A.D. Businger. 2014. Evapotranspiration of Hawaiʻi. Final report submitted to the U.S. Army Corps of Engineers, Honolulu District, and the Commission on Water Resource Management, State of Hawaiʻi.
We downloaded the data from the Rainfall Atlas of Hawaiʻi, the University of Hawaiʻi project that now hosts the evapotranspiration atlas for the main Hawaiian Islands.
Explore the data yourself: the UH Hawaiʻi Climate Data Portal publishes interactive climate maps, live readings from the Hawaiʻi Mesonet station network (live data), and monthly climate summaries.