
Cloud cover in Volcano Village runs near 31% at 6am and near 75% by early afternoon, a 43-point swing inside a single day. The village sits at nearly 4,000 feet just outside Hawaiʻi Volcanoes National Park, so it is cool and wet: 60.1°F and 122 inches of rain a year, about 15°F cooler than Kona.
If you’re staying in Volcano or driving up for the park, plan the day around that. Highs reach 66 to 72°F and lows drop to 50 to 56°F, and afternoon cloud cover averages over 70%, so see anything you want a clear view of in the morning. November is the wettest month at 15.5 inches, June the driest at 7.2.
Table of contents
- Volcano Village weather by month (January to December)
- A typical day in Volcano: average daily weather
- Volcano Village weather summary in a table: temperature, rainfall, and cloud cover throughout the year
Volcano Village is about 15°F cooler than Kona, so evenings need a sweater. Expect rain and sun on the same day, and pack a light raincoat either way. The rainforest is here because of that rain.
For how the weather works across the whole of Hawaiʻi Island, start with our main weather guide:
Weather on the Big Island, Explained
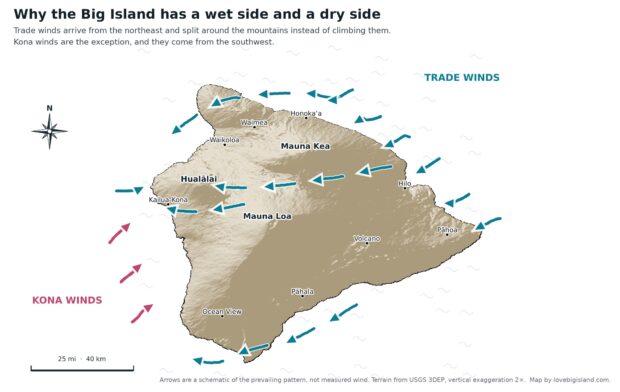
Hilo gets 120 to 151 inches of rain a year, the Kohala coast under 10. Daytime highs sit in the high 70s to high 80s every month. Pick your side first.
Monthly average Volcano weather: temperature, rainfall and cloud cover
Monthly average temperatures in Volcano Village range from 57°F (14°C) in February to 63°F (17°C) in August. Those are whole-day averages, which flattens the real spread: the average daily low sits about 16°F below the average daily high.
Average daily highs run between 66°F and 72°F (19 to 22°C), which is walking weather for Hawaiʻi Volcanoes National Park rather than the heat you get at sea level. Lows drop to between 50°F and 56°F, and the air up here is humid, so early mornings and nights feel colder than the thermometer reads. Bring a layer.

Volcano Village is wet: 122 inches a year, more than three times what Waimea gets at 37 inches and thirteen times Waikoloa’s 9. The rain concentrates between November and April, peaking in November at 15.5 inches and March at 14.1. March and April are the cloudiest months and August and September the clearest; November, the wettest month, has middling cloud cover.
If you want to dodge the rain, check the forecast and time your Volcano days around it. Everyone else should expect some of both on the same day. Plenty of the vacation rentals here come with a fireplace or a hot tub, so bring a raincoat and a swimsuit.
Hourly average Volcano weather: air temperature and cloud cover
The annual figure is 51%, but cloud cover here varies far more than that across a single day. It bottoms out near 31% around 6am and climbs steadily from there, passing 60% by late morning and topping out near 75% in the early afternoon, where it holds until evening. If you want a clear view of anything up here, take it before mid-morning.

Air temperature follows the same curve, moving about 8°F between a pre-dawn low near 57°F and an early-afternoon high near 65°F.
Volcano weather forecast
Everything on this page is a long-term average. Any given day in Volcano can be well off these numbers.
For the seven-day outlook, check the NOAA point forecast for the Volcano area; the point you want is labelled “3 Miles E Hawaii Volcanoes National Park”. That page’s current-conditions box reports from Hilo airport, 25 miles away and far closer to sea level, so it reads warmer than Volcano. Over a year Hilo averages 72.8°F against Volcano’s 60.1°F.
Weather summary for Volcano Village
Of the five Big Island towns we chart, Volcano is the coolest at 60.1°F and the second wettest after Hilo, 122.3 inches against Hilo’s 142.1. If you want a dry base on the same island, Waikoloa averages 9 inches a year and Kona 27.
| month | Temperature (°F) | Rainfall (in) | Cloud Frequency (%) |
|---|---|---|---|
| January | 57.36 | 11.49 | 49.54 |
| February | 57.06 | 9.76 | 57.51 |
| March | 57.53 | 14.06 | 65.31 |
| April | 58.71 | 11.45 | 60.18 |
| May | 59.96 | 8.00 | 55.48 |
| June | 61.75 | 7.15 | 48.70 |
| July | 62.42 | 9.26 | 42.00 |
| August | 62.95 | 8.33 | 38.90 |
| September | 62.62 | 8.05 | 41.05 |
| October | 62.25 | 7.90 | 51.74 |
| November | 60.18 | 15.47 | 54.02 |
| December | 58.15 | 11.43 | 51.69 |
| Annual | 60.08 | 122.34 | 51.34 |
Sources
All tables and figures on this page were created by Love Big Island using data from Giambelluca, T.W., X. Shuai, M.L. Barnes, R.J. Alliss, R.J. Longman, T. Miura, Q. Chen, A.G. Frazier, R.G. Mudd, L. Cuo, and A.D. Businger. 2014. Evapotranspiration of Hawaiʻi. Final report submitted to the U.S. Army Corps of Engineers, Honolulu District, and the Commission on Water Resource Management, State of Hawaiʻi.
We downloaded the data from the Rainfall Atlas of Hawaiʻi, the University of Hawaiʻi project that now hosts the evapotranspiration atlas for the main Hawaiian Islands.
Explore the data yourself: the UH Hawaiʻi Climate Data Portal publishes interactive climate maps, live readings from the Hawaiʻi Mesonet station network (live data), and monthly climate summaries.