
Waiʻaleʻale rises 5,148 feet at the center of Kauaʻi, and the rain gauge near its summit has long averaged over 370 inches a year, among the highest ever measured. The west side past Waimea gets about 20. Every shore gets an amount between those two: the north and east face the trade winds and stay green, the south and west sit in the lee and stay dry.
November is the wettest month and June the driest; temperature is steadier, with Poʻipū and Princeville separated by barely more than a degree over a full year. Kauaʻi has 6 of the world’s 13 climate zones on 550 square miles.
Table of contents
What is the best time to visit Kauaʻi?
For the south shore, any month: Poʻipū stays dry and warm year round. The north shore is different in winter: Nāpali Coast boat tours run from the south side and Hanalei takes its heaviest rain. Humpback whales arrive in those same months. Our full guide to the best time to visit Kauaʻi weighs all of it month by month. Hurricane season, June through November, is covered on our Hawaiʻi weather page.
Kauaʻi at a glance
Month by month: temperature, rainfall, and cloud
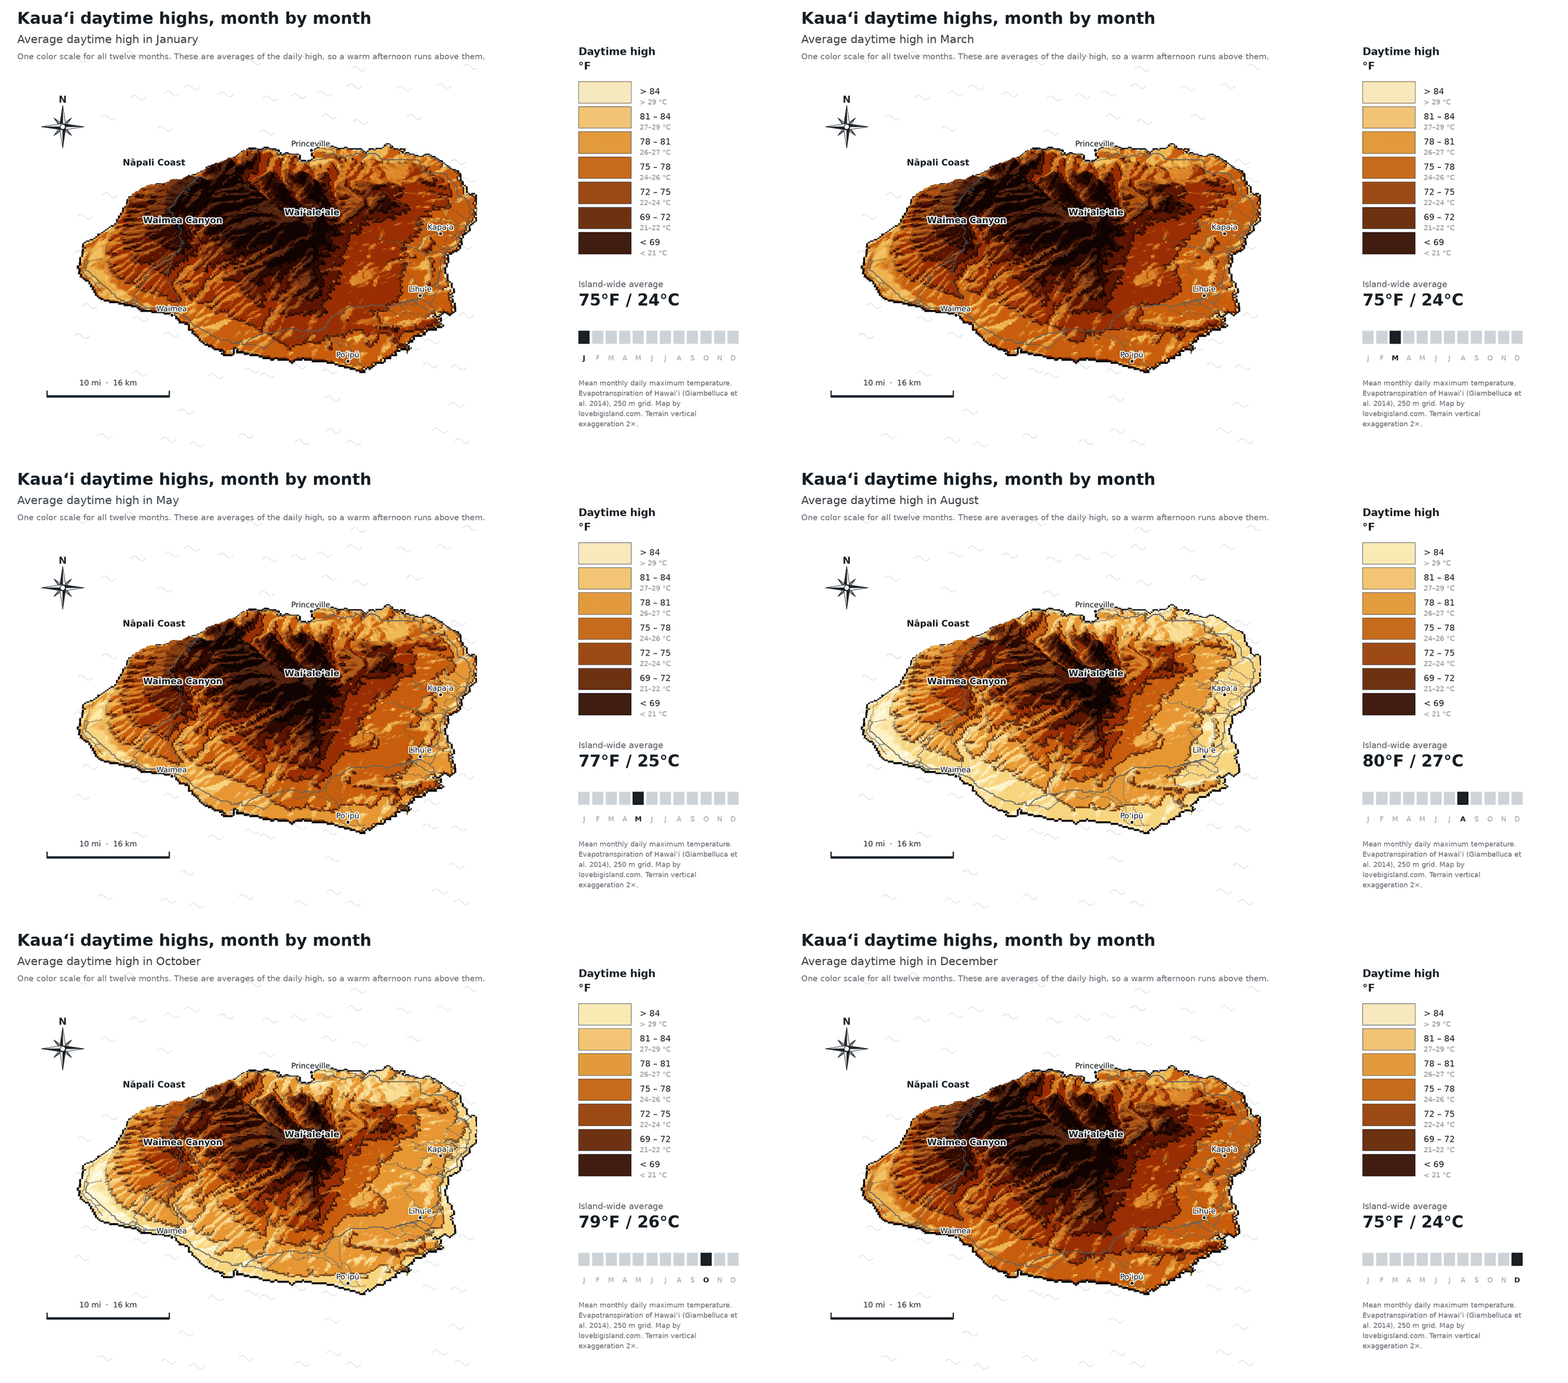
Kauaʻi has two seasons, and neither is cold. Winter, roughly October through April, brings more rain and bigger surf on the north shore. Days run slightly cooler. Summer, May through September, is drier and warmer, and the trade winds blow more reliably. The island-wide average daytime high moves from 74.7 F in February to 80.4 F in September, a swing of under six degrees.
A February beach day in Poʻipū feels close to an August one. The north shore does change: Hanalei Bay is calm enough for paddling in August and has heavy surf in January.
Temperatures stay in a narrow band
At Līhuʻe Airport the average daily high runs from 78.1 F in February to 85.3 F in September, and nights range from 66.0 F in January to 75.2 F in August. Princeville’s afternoons are as warm, peaking at 85.9 F in August, but its nights run cooler all year, down to an average 62.3 F in January. Pack one light layer for winter evenings on the north shore; everything else in the table is shorts weather.
| Month | Līhuʻe high / low | Princeville high / low |
|---|---|---|
| January | 79 / 66 | 78 / 62 |
| February | 78 / 66 | 77 / 63 |
| March | 79 / 67 | 77 / 63 |
| April | 80 / 70 | 80 / 65 |
| May | 82 / 71 | 83 / 67 |
| June | 83 / 73 | 84 / 68 |
| July | 85 / 75 | 85 / 69 |
| August | 85 / 75 | 86 / 70 |
| September | 85 / 75 | 85 / 70 |
| October | 84 / 74 | 83 / 68 |
| November | 81 / 71 | 80 / 67 |
| December | 79 / 69 | 78 / 65 |
| Average daily high and low in °F, NOAA 1991-2020 normals. Līhuʻe is Līhuʻe Airport (USW00022536), Princeville is Princeville Ranch (USC00518165). These are monthly averages, not records: a warm afternoon runs above the high, a cool night below the low. | ||
The interior runs cooler than the coast in every month. January and February are the coolest, at an island-wide average daytime high of 74.7 F; September is the warmest at 80.4, with August right behind at 80.0. Those figures average in the cool interior, so the shore is warmer than the island-wide figures: Līhuʻe’s September normal high is 85.3 F. On Kauaʻi, elevation changes the temperature far more than the time of year does, and every beach sits at the warm end of the scale in every month.
Rainfall is where the seasons show
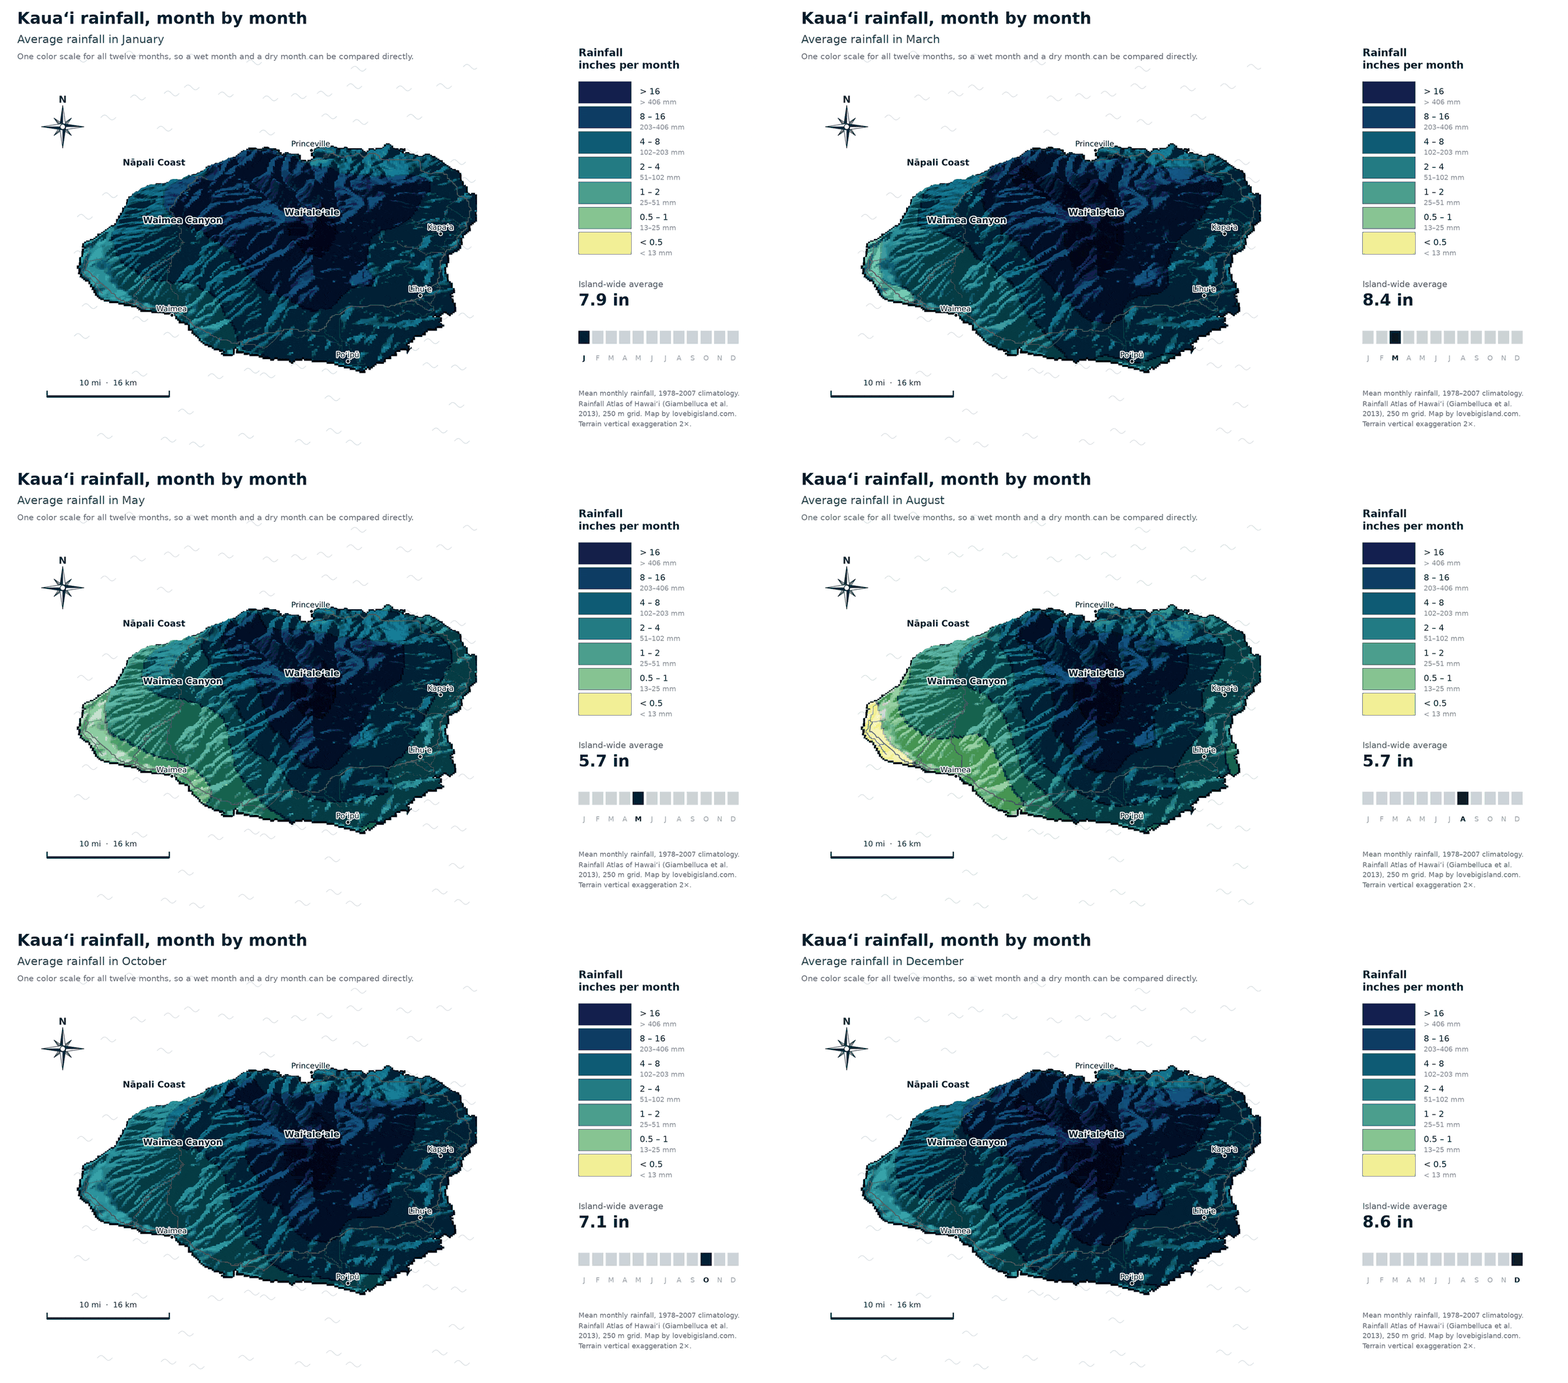
November is the wettest month island-wide at 9.3 inches, with December and March close behind at 8.6 and 8.5. June is the driest at 5.1. Every month from October through April clears 6.7 inches, and no month from May through September reaches 6. October, at 7.1 inches, is the first month since April to top 6 inches.
These are averages over the whole island, soaked interior included, so an island-wide 9.3-inch November overstates what any single shore gets. Most of that rain falls on the mountains and the north and east sides. The table below samples a single town on each shore, wettest to driest.
| Place | in / yr | mm / yr | Setting |
|---|---|---|---|
| Hanalei | 81 | 2,060 | North shore bay |
| Princeville | 75 | 1,910 | North shore, wet |
| Kōloa | 57 | 1,460 | South, inland of Poʻipū |
| Wailua | 46 | 1,180 | East, river mouth |
| Līhuʻe | 45 | 1,140 | East, the airport town |
| Kapaʻa | 42 | 1,060 | East, the Coconut Coast |
| Poʻipū | 37 | 940 | South shore, sunny |
| Waimea | 20 | 520 | West coast, dry |
| Kekaha | 19 | 490 | West coast, driest town |
Winter rain and winter surf arrive together, and both hit the north shore first. Nāpali Coast boat tours move their departures to the island’s south side for the winter because the north-facing swell makes the run too rough. Hanalei takes its heaviest rain in those same months, while Poʻipū, in the lee of the mountains, keeps most of its sun.
Sunny skies and cloud cover on Kauaʻi
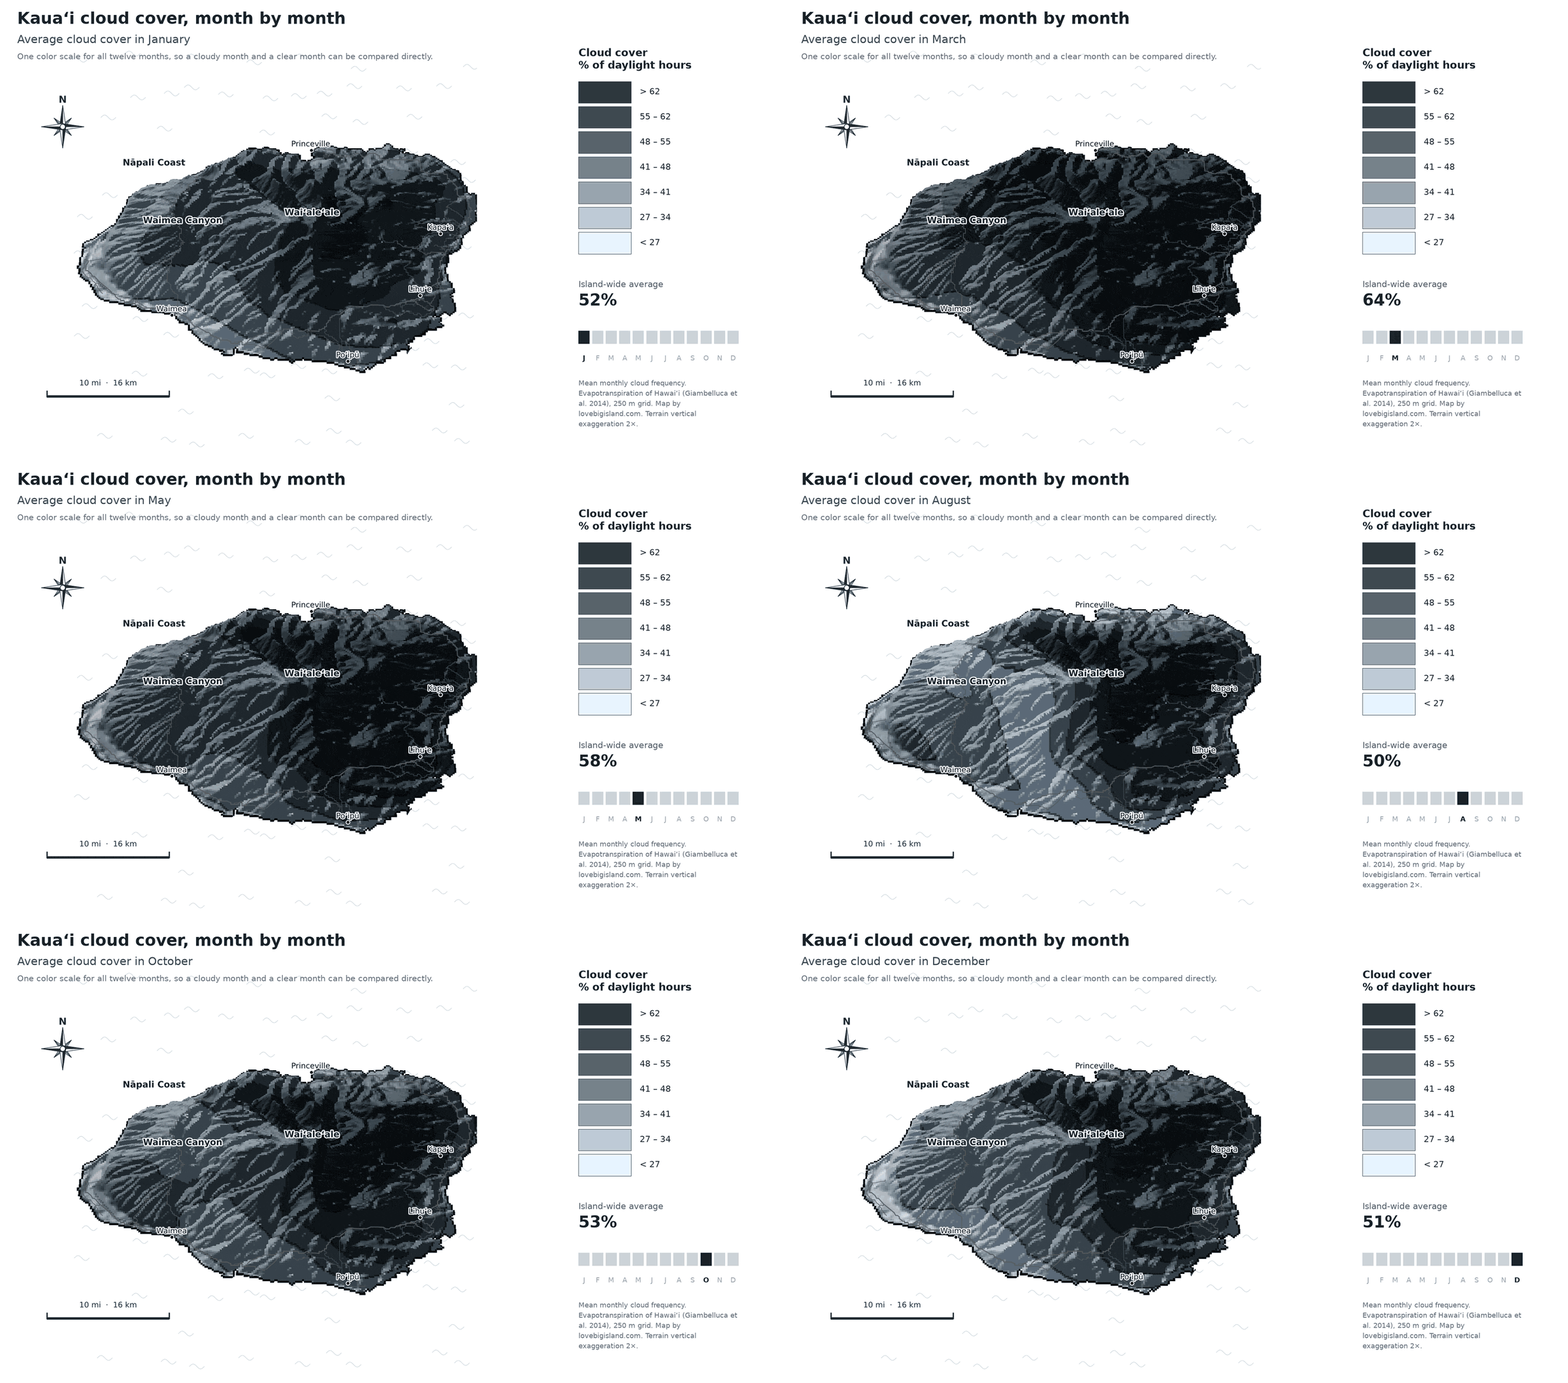
March is the cloudiest month, with cloud over the island for 64 percent of daylight hours on average, and it is one of the wettest at 8.5 inches. September is the clearest at 46 percent and has the year’s warmest afternoons. If your dates are flexible, September is the strongest weather bet Kauaʻi has.
Cloud doesn’t track rain exactly. The atlas grid puts Līhuʻe under cloud 57 percent of daylight hours against Princeville’s 49, even though Princeville gets 30 more inches of rain a year. Poʻipū sits at 42 percent, the sunniest of the three, so the same afternoon can be gray in Līhuʻe and clear over the Poʻipū beaches.
Book the south shore if the trip is built around beach and pool days. Its 42 percent cloud and 37 inches of rain are as sunny as this island gets, short of driving out to Waimea.
How the trade winds shape local weather
The trade winds arrive from the northeast on 80 to 95 percent of days from May through September, and on 50 to 80 percent of days from October through April, per NOAA’s climatography. On most high islands the moist air climbs the windward slope, cools, and drops its rain there. On Kauaʻi the trades largely wrap around the Waiʻaleʻale massif rather than climbing over it, so the wet-dry line curls around the island instead of cutting it in half. Princeville and Poʻipū sit on the same ocean, one ridge of mountains apart.
The windward side catches the rain
Princeville and the north and east shores face the incoming trades. The air rises over the mountains, cools, and drops its rain on the way: Princeville averages 75.3 inches a year, and Līhuʻe on the east side 45.1. Both stay green year round, and both take their heaviest rain in winter.
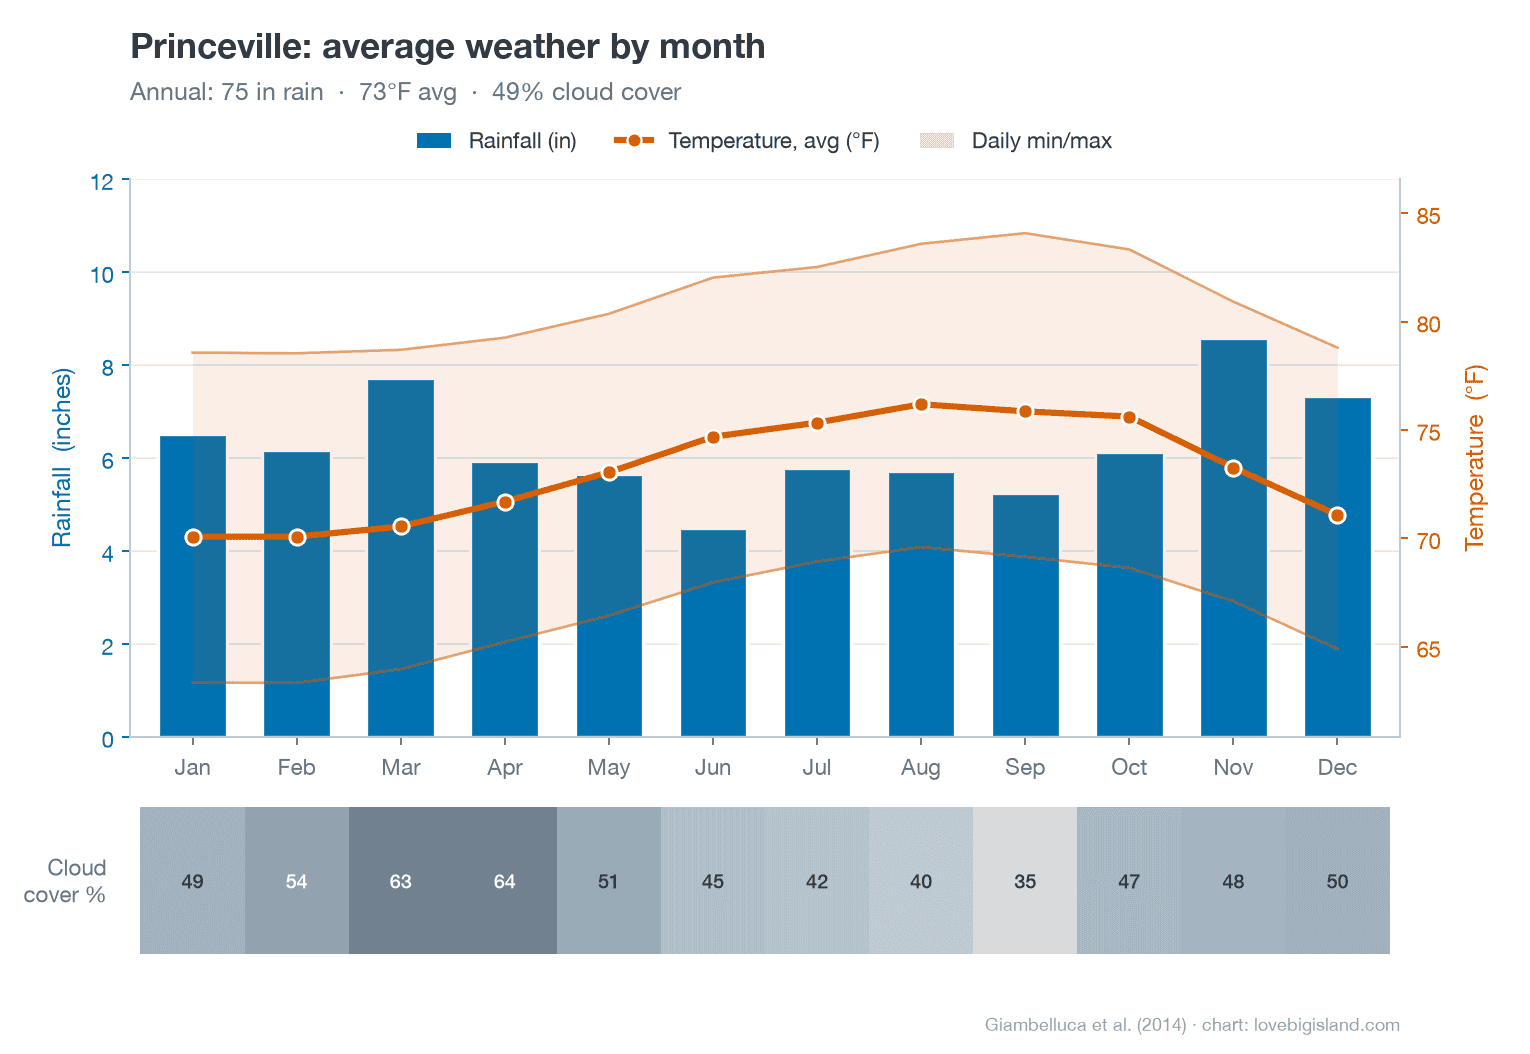
Princeville, the wet shore: 75.3 inches of rain a year under 49 percent daytime cloud. Shown on the same rainfall scale as the Poʻipū chart below, so the wet-dry gap is plain. Data: Giambelluca et al. (2013, 2014), 250 m grid. Chart by Love Big Island.
The leeward side sits in the rain shadow
Poʻipū sits around the corner in the lee and gets 37.0 inches a year; past Waimea the annual total drops to about 20. Mean temperatures across all these points sit within 1.3 degrees of each other, so position in the wind, not warmth, is what separates the shores. On a wet morning at an east-side hotel, drive west: the deepest lee is toward Waimea, and it is drier there on most days the trades blow. And when you would rather stay put and dry off, our Kauaʻi rainy day activities guide sorts the best indoor stops by region.
The exception is Kona wind. When a winter front breaks down the trades, the wind swings to the southwest and the pattern flips: rain reaches Poʻipū and the west side while the north shore gets a break. Expect that mostly between October and April.
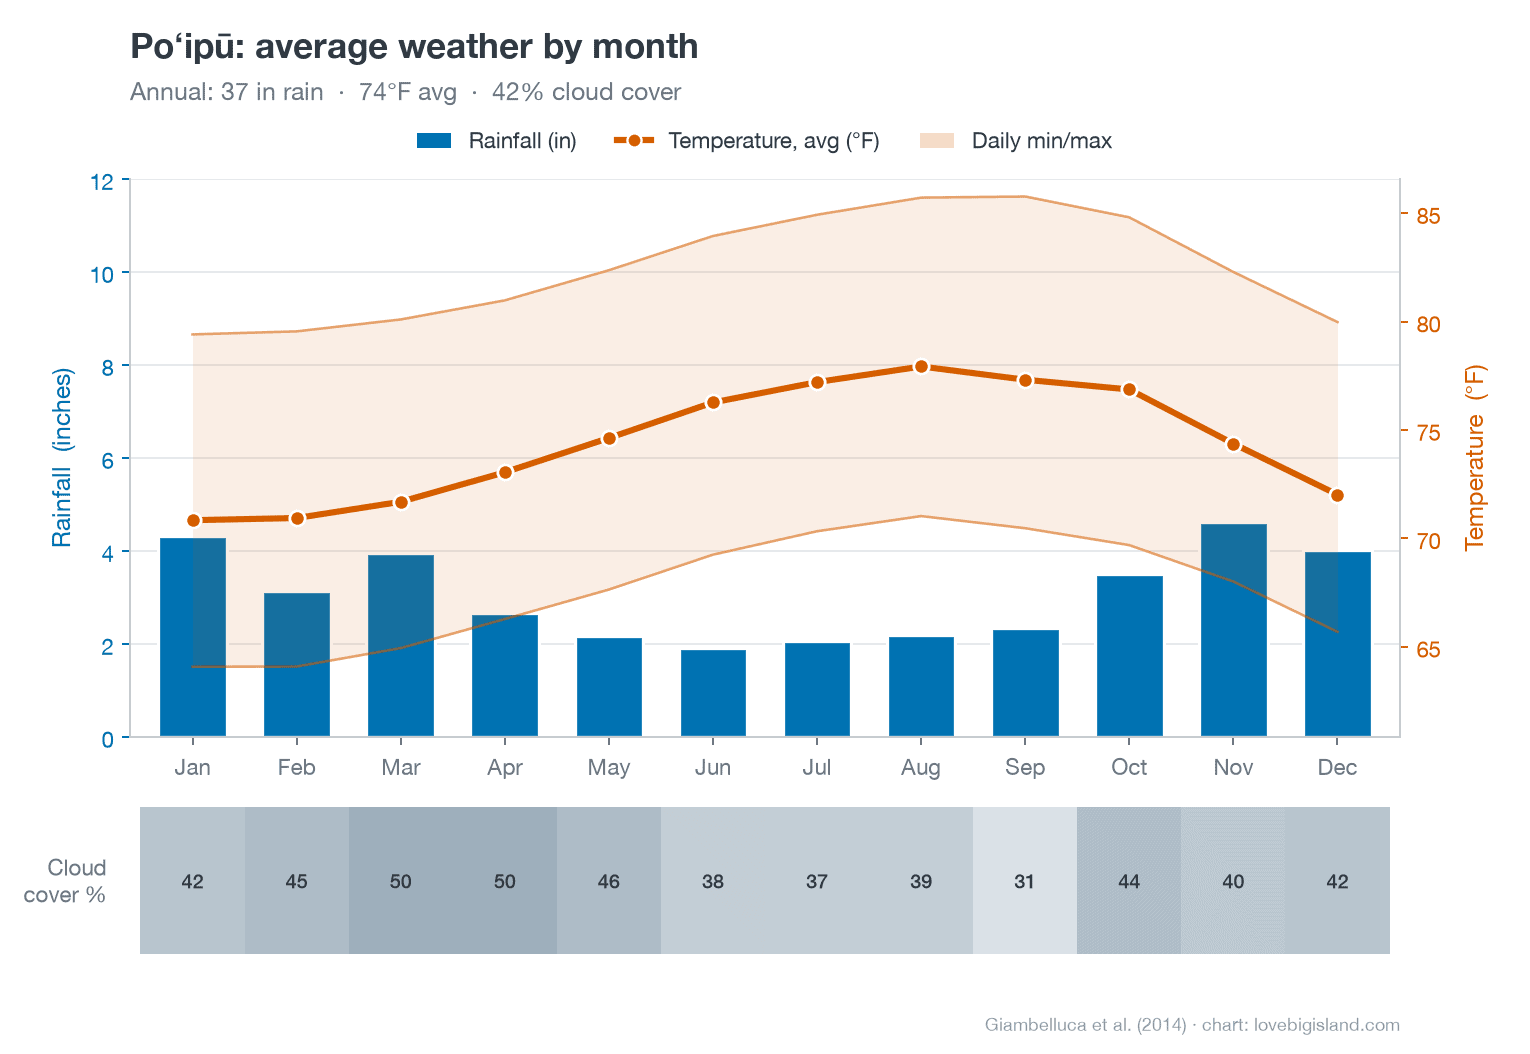
Poʻipū, the dry shore: 37.0 inches of rain a year under 42 percent daytime cloud, on the same rainfall scale as the Princeville chart above. Data: Giambelluca et al. (2013, 2014), 250 m grid. Chart by Love Big Island.
Beach days and ocean conditions
Kauaʻi’s south and west shores give you the most beach days, dry and bright most of the year, while the north and east shores catch the trade showers that keep them green. The water stays warm all year, from about 74°F in late winter to 80°F by early fall. High surf and brown water can both spoil a swim on an otherwise sunny day, and neither shows up in a weather forecast.
Beach days
Kauaʻi’s beach weather changes more from shore to shore than from day to day. We rate eleven of its beaches for beach weather.
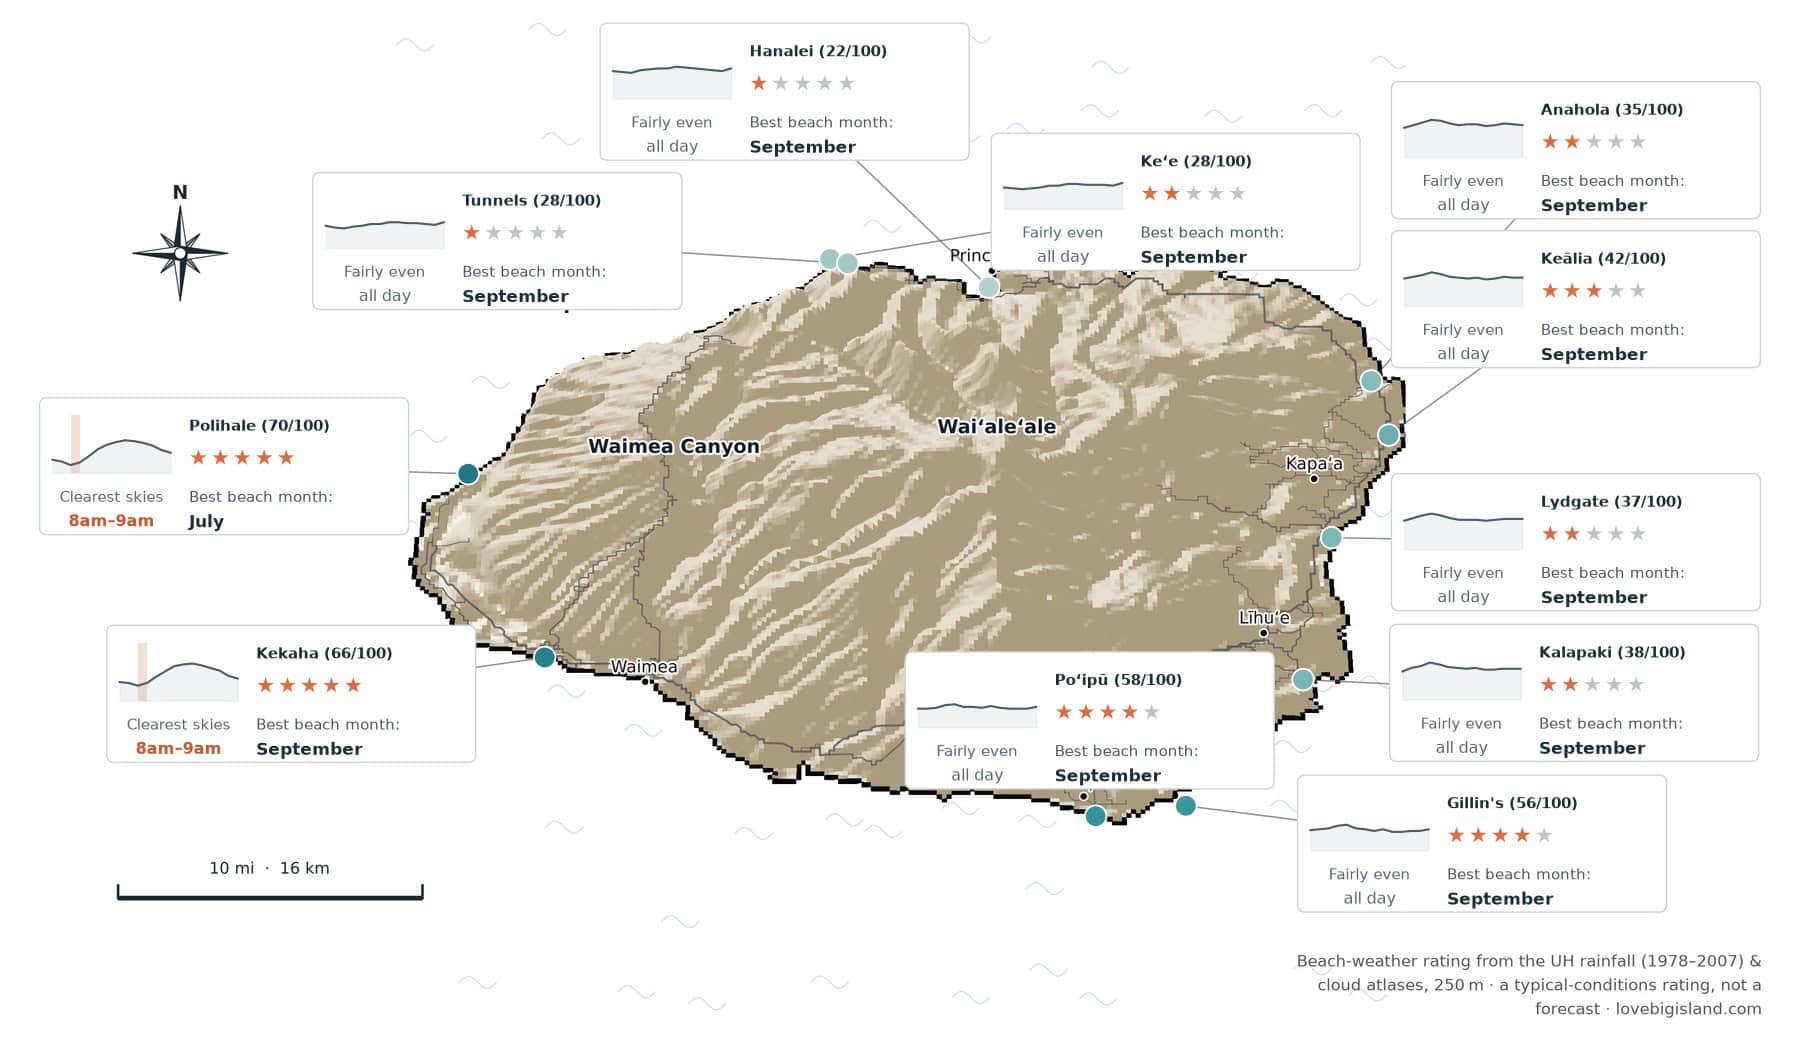
A beach-weather rating for eleven Kauaʻi beaches, deep blue for the best. Each card marks the beach’s score out of 100, the month it’s at its best, how cloudy a typical day runs hour by hour, and the clearest hours in orange (or fairly even all day where cloud barely shifts). Data: UH rainfall and cloud atlases, 250 m. Map by Love Big Island.
The west and south shores have the best beach weather: Polihale and Kekaha out west, Poʻipū and Gillin’s in the south, all dry and often clear. The east-shore beaches around Līhuʻe and Kapaʻa rate in the middle, greener and cloudier. The north-shore beaches, Hanalei and Tunnels and Keʻe, are the wettest on the island. The clearest hours come in the morning on the west and south shores, early afternoon on the windward east and north.
How we rate the beach days
We rate each beach on how many good beach hours you can count on. The score comes from how much rain falls and how cloudy the sky is, averaged month by month over thirty years. The scores are relative, comparing these beaches with each other rather than promising sun on any day: a higher one means more dry, bright days over the year. The best month is the month that scores highest, when both rain and cloud bottom out. The clearest hours come from a separate record of how cloudy it gets hour by hour through a typical day: mornings on the west and south shores, early afternoon on the windward side.
Brown water
Brown water is what runs off the land after heavy rain: storm runoff carrying pathogens from cesspools and septic tanks, animal waste from storm drains, sewage from overflowing manholes, and chemicals from paved runoff. It turns the nearshore water murky and brown, and Kauaʻi is named in the state’s advisory. One of the heaviest single-day rainfalls ever recorded in the United States fell on the island’s north shore in April 2018, and brown water can follow any hard rain. Stay out of brown water, and out of the streams feeding it, until it clears. The Hawaiʻi Department of Health sets no waiting period, so do not trust the common 48-hour figure; that number belongs to sewage and chemical spills, not storm water.Check the Clean Water Branch’s map of current beach advisories for what’s posted where you’re staying.
Surf
The north shore sees the year’s largest swells in winter, when Hanalei Bay and the Nāpali coast turn dangerous and the boat tours shift to the south side; south-facing shores get their turn in summer. The north shore can still have heavy surf in a dry, sunny January week, so check the National Weather Service Hawaiʻi surf zone forecast for the specific shore you’re swimming off before you go in.
Waiʻaleʻale, among the wettest places on Earth
Waiʻaleʻale rises 5,148 feet at the center of the island, and the rain gauge near its summit has long averaged over 370 inches of rain a year. That is ten times the rain that falls on Poʻipū, on the same small island. You will see it called the wettest spot on Earth: that title rests on a 1980s figure of 486 inches that modern gauges have not matched, but it remains one of the two or three wettest places ever measured, and among the best-measured. A 2013 study by Ferrier and colleagues found that Kauaʻi has more than 70 percent of the range of rainfall rates found anywhere on Earth within 25 kilometers of ground.
All of that water drains outward and feeds the island’s rivers and waterfalls. Cloud covers the summit most days, and visitors rarely see it clear.
Plan around the shores instead. The rain up there keeps the rivers running and the north shore green; Poʻipū gets 37 inches a year on an island whose center catches 370. For sun, stay in Poʻipū: it stays dry and warm year round.
Sources and methods
- Temperature normals and the monthly high/low table: NOAA 1991–2020 station normals, Līhuʻe Airport and Princeville Ranch.
- Rainfall maps and the town rainfall table: UH Rainfall Atlas of Hawaiʻi (Giambelluca et al. 2013), 250 m grid, 1978–2007.
- Temperature and cloud maps, and the Princeville and Poʻipū climate charts: UH Evapotranspiration Atlas (Giambelluca et al. 2014), 250 m grid.
- Beach-weather map: the same UH rainfall and cloud atlases, 250 m. A relative, typical-conditions rating, not a forecast and not a count of good days.
- Trade-wind frequencies: NOAA climatography of Kauaʻi.
- Rainfall gradient across the island: Ferrier et al. (2013), Geological Society of America Bulletin.
- Brown-water advisories: Hawaiʻi Department of Health, Clean Water Branch.
- Surf: National Weather Service Honolulu surf zone forecast.
- Explore the data yourself: the UH Hawaiʻi Climate Data Portal publishes interactive climate maps, live readings from the Hawaiʻi Mesonet station network (live data), and monthly climate summaries.