
Hāna gets 67.7 inches of rain a year, close to six times what falls on Kīhei across the island, yet it averages 73.65°F, a little over a degree cooler. The trade winds hit Maui’s east coast first and drop their moisture on this side, and Hāna sits right in the middle of it.
Days reach 79 to 85°F and nights drop to 64 to 70°F, so a light layer is all the warmth you’ll need. Pack for rain instead: it falls on most days here, usually as short showers with sun in between. Our Maui rainy day activities guide covers what to do indoors.
Table of contents
- Hāna weather on a month-by-month basis (January to December)
- Rain on 267 days a year: how often it rains in Hāna, and how hard
- Ten miles past Hāna: rainfall from town to Kīpahulu and ʻOheʻo Gulch
- A typical day in Hāna: average daily weather
- Hāna weather summary in a table: temperature, rainfall, and cloud cover throughout the year
Hāna sits at the end of the Hāna Highway on Maui’s windward east coast. It rains all year here rather than mostly in winter: March is the wettest month at 8.5 inches, June the driest at 3.5, and that driest month still gets more rain than Kīhei’s wettest (January, at 2.8 inches).
Days of extreme rain are rare. Over its 1950-2012 record, the Hāna Airport gauge recorded 17.57 inches in a single day on April 16, 1968, and 40.86 inches across the month of April 1989. Both stand far outside the monthly averages below.
For how the weather works across the whole of Maui, and why the windward side is the wet side, start with our main Maui weather guide. The same trade-wind split gives Maui 7 of the world’s 13 climate zones:
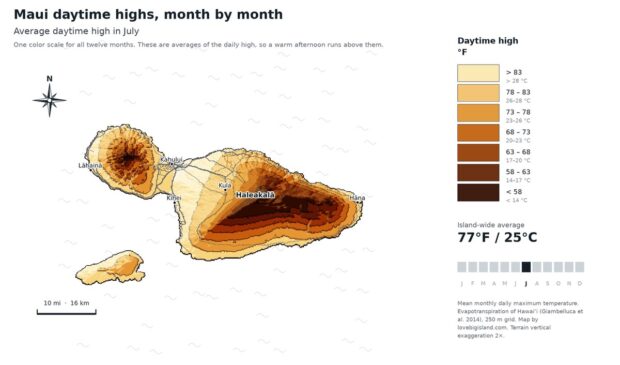
Maui Weather by Month: Which Side to Stay On
Kīhei gets rain on 36 days a year, Hāna on 267. How Maui weather works month by month, what a rain percentage really means, and which coast to pick.
Monthly average Hāna weather: temperature, rainfall and cloud cover
Monthly average temperatures in Hāna run from 70°F (21°C) in January and February to 77°F (25°C) in August, with September and October just behind.
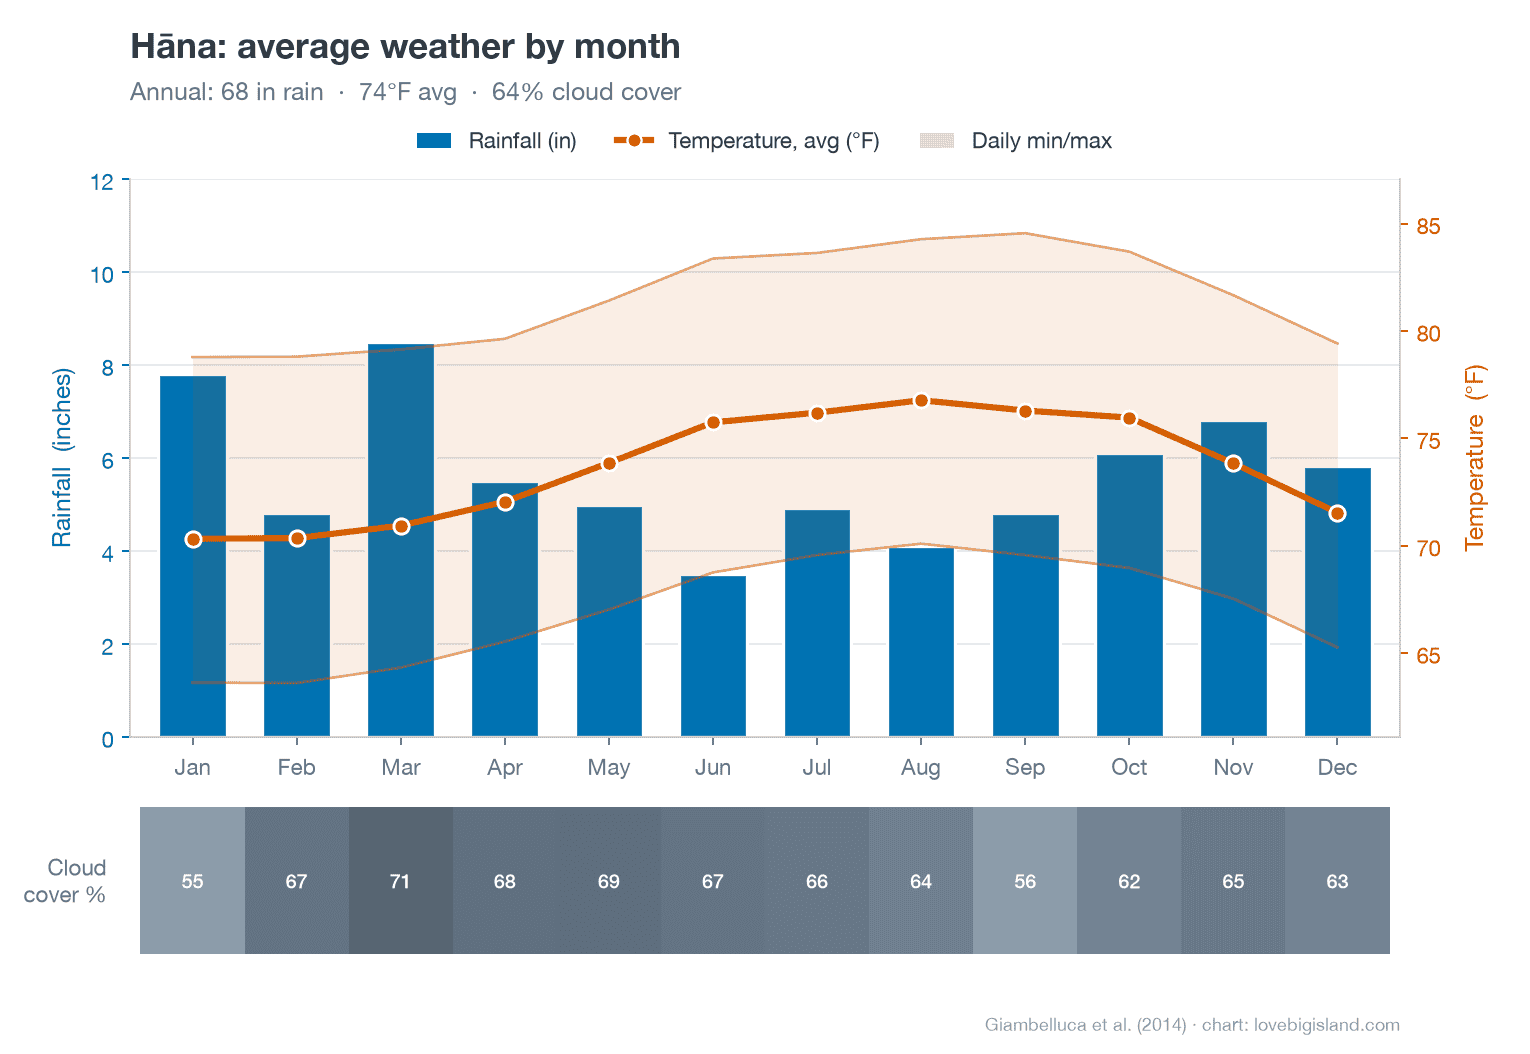
Those are whole-day averages. The average daily high runs from 79°F in winter to 85°F in early fall, and the average daily low from 64 to 70°F, a day-to-night swing of 14 to 15 degrees. Between 1950 and 2012, the temperature at Hāna Airport stayed between 50 and 94°F. It has never frozen here, and temperatures in the 90s are rare.
NOAA’s 1991-2020 normals for the Hāna Airport gauge show daily highs between 77.3°F in February and 82.9°F in August, with 72.2 inches of rain a year. The airport gauge is a different measurement point and covers a different period than the atlas figure behind our table, so its rain total is a few inches above the 67.7 we chart.
Cloud cover averages 64% across the year, cloudiest in March at 71%. January is both the clearest month at 55% cloud and the second wettest at 7.8 inches: showers here pass quickly.
Rain on 267 days a year, over an inch on only 15
Rain fell on about 267 days a year over the 1950-2012 record at Hāna Airport. Only 158 of those days reached a tenth of an inch, and only about 15 in a typical year topped a full inch. The rest were light, brief showers.
July has 26 rain-days, more than any other month, in the middle of the nominal dry season. A shower nearly every day, with little water in each one.
So pack a rain shell that stuffs into a daypack and skip the umbrella. When a shower starts, keep doing what you were doing.
Ten miles past Hāna, rainfall nearly triples
Hāna, at 68 to 72 inches a year, is the driest part of this coast. At Kīpahulu, ten miles down the road where the ʻOheʻo Gulch pools sit inside Haleakalā National Park, the Park Service puts average rainfall at 187 inches a year. The slopes above town get more than 300.
The maximum-rainfall belt on this side of Haleakalā sits at roughly 2,000 to 3,000 feet, well above both the town and the highway.
If you drive on to ʻOheʻo Gulch, plan on more rain than you saw in town, arriving more often, and know that the pools themselves are closed to entry under a standing safety closure: you can see them from the half-mile Kūloa Point Trail. Daytime temperatures there are 70 to 80°F, close to Hāna’s, so a rain shell is the only extra gear you need for the second half of the drive.
Hourly average Hāna weather: air temperature and cloud cover
Cloud cover stays between about 61% and 69% around the clock: it peaks near 69% around 9am, eases through the day, and reaches its low near 61% around 9pm. Kīhei’s cloud cover climbs from about 25% in the early morning to 60% by 2pm; Hāna’s cloud cover moves about eight points all day.
The cloudy end of the day here is the morning, not the afternoon. There is no reliably clear window and no reliably grey one either: the odds of cloud are roughly two in three whenever you look up, so plan stops by drive time, not by waiting on the sky.

Air temperature runs from about 70°F just before dawn to 79°F in the early afternoon. That is the hourly average across all days, so it sits inside the wider daily high and low above.
Hāna weather forecast
Everything on this page is a long-term average. Any given day in Hāna can differ a lot from these numbers, and a passing shower and full sun are often minutes apart.
For the seven-day outlook, check the NOAA point forecast for Hāna.
For a zone forecast, read Windward Haleakalā. Hāna and the whole windward coast sit in that one zone, which runs from the shore to the summit.
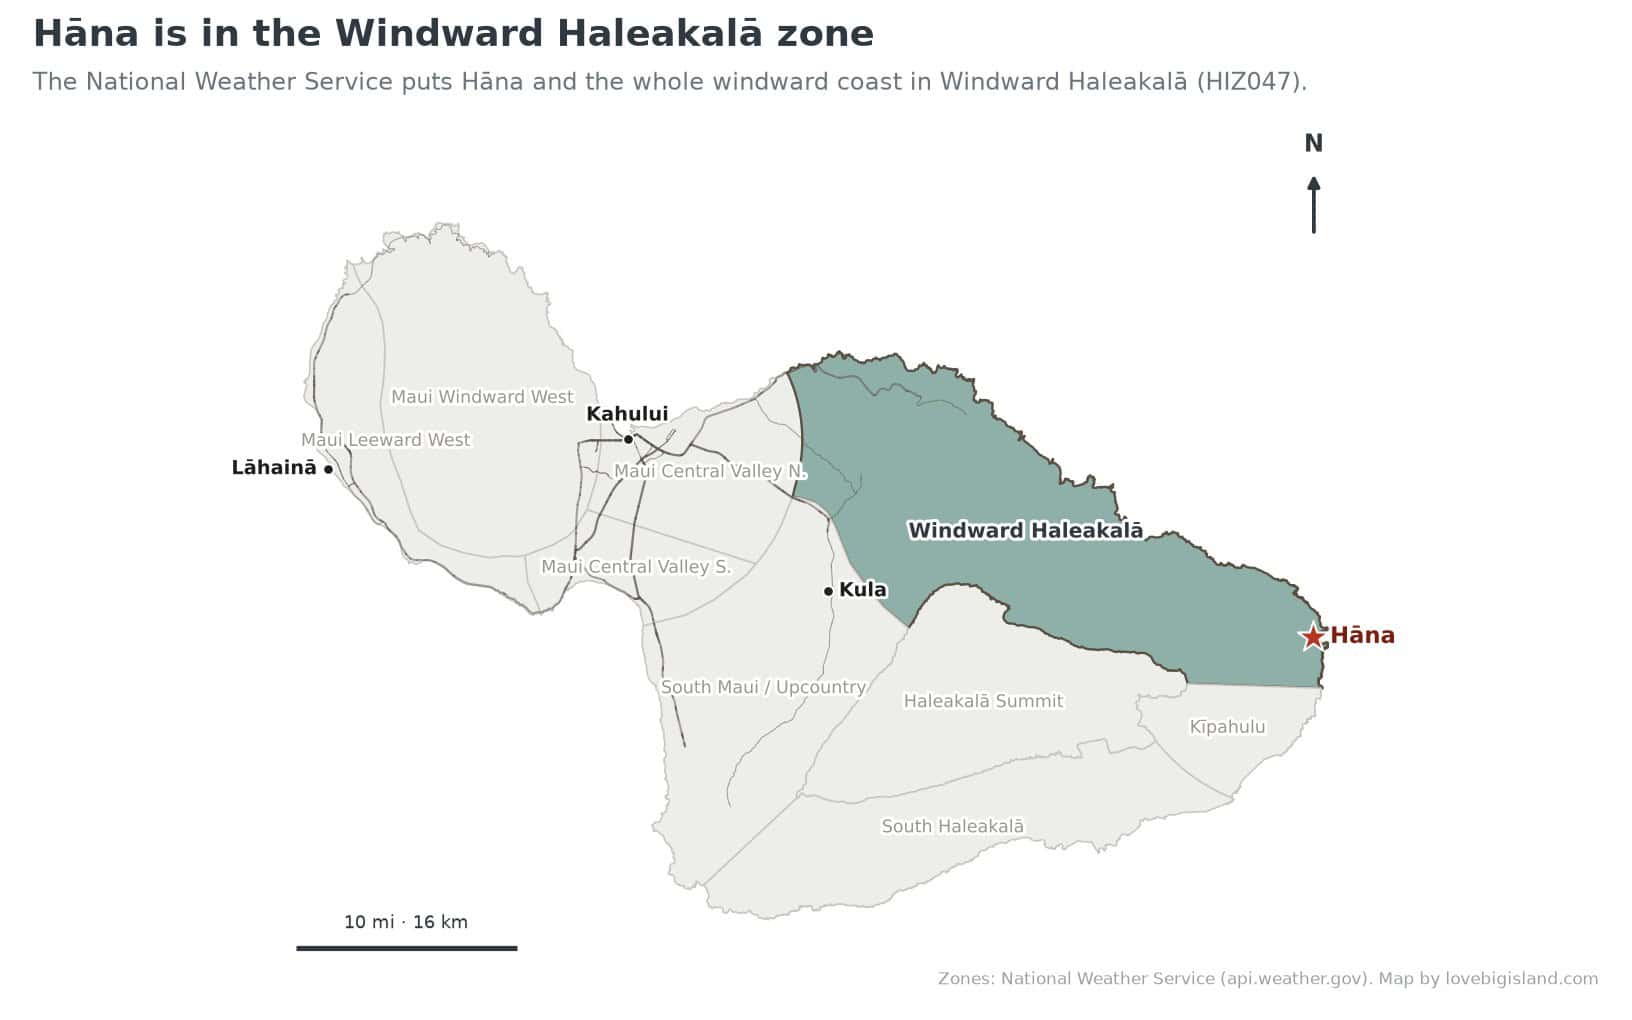
Hāna and the whole windward coast sit in the National Weather Service's Windward Haleakalā forecast zone (HIZ047), which runs from the shore to the summit. Zones: National Weather Service. Map by Love Big Island.
Weather summary for Hāna
Of the three Maui towns we chart, Hāna is the coolest at 73.65°F against about 75 in both Kīhei and Lāhainā, the wettest at 67.7 inches against 11.5 and 13.3, and the cloudiest at 64% against 39 and 40. If you’re driving the Hāna Highway as a day trip, judge the weather by this page, not by the sky over your hotel: a clear morning in Kīhei does not mean a clear day on the east coast.
| month | Temperature (°F) | Rainfall (in) | Cloud Frequency (%) |
|---|---|---|---|
| January | 70.32 | 7.801 | 55.21 |
| February | 70.35 | 4.809 | 67.15 |
| March | 70.93 | 8.500 | 71.20 |
| April | 72.04 | 5.504 | 68.00 |
| May | 73.85 | 4.984 | 68.55 |
| June | 75.74 | 3.509 | 66.96 |
| July | 76.19 | 4.929 | 66.00 |
| August | 76.77 | 4.104 | 63.56 |
| September | 76.29 | 4.827 | 56.02 |
| October | 75.96 | 6.104 | 61.57 |
| November | 73.83 | 6.821 | 65.31 |
| December | 71.53 | 5.822 | 62.60 |
| Annual | 73.65 | 67.714 | 64.34 |
Sources and methods
- Monthly and hourly temperature, rainfall and cloud: Hāna’s own point in the University of Hawaiʻi 250-metre atlas grid, from Giambelluca et al. (2014), Evapotranspiration of Hawaiʻi, via the Rainfall Atlas of Hawaiʻi. Annual figures are gridded estimates that interpolate between gauges.
- Rain-day count: Western Regional Climate Center period-of-record summary for the Hāna Airport gauge, 1950–2012.
- Forecast zone: National Weather Service public forecast zones (api.weather.gov).
- Explore the data yourself: the UH Hawaiʻi Climate Data Portal publishes interactive climate maps, live readings from the Hawaiʻi Mesonet station network (live data), and monthly climate summaries.