
Cloud cover over Lāhainā stays near 30% through the night and roughly doubles by early afternoon. It bottoms out near 29% around 11pm and peaks near 58% around 2pm, so nights here are usually clear and afternoons partly cloudy. The town sits on the dry lee shore of the West Maui Mountains and averages 75°F and 13 inches of rain a year.
If you’re staying in Lāhainā or a few minutes north along the Kāʻanapali resort coast, which shares the same pattern, leave the sweater at home. Nights run 64 to 71°F and days reach 80 to 86°F. September is the clearest month here, December the wettest at 2.8 inches.
Table of contents
- Lāhainā weather on a month-by-month basis (January to December)
- 5.4 miles inland: how fast the rain climbs behind town
- Kāʻanapali and Kapalua: how often it rains on each
- The afternoon wind: a sea breeze, and the heat behind it
- A typical day in Lāhainā: average daily weather
- Lāhainā weather summary in a table: temperature, rainfall, and cloud cover throughout the year
The West Maui Mountains rise directly behind town, and the trade winds drop their rain on them before reaching this coast. That is why Lāhainā gets 13 inches of rain a year while Hāna, on Maui’s windward side, gets 68. What rain does fall arrives mostly in winter: 9.3 of those 13 inches fall from November through February, much of it from kona storms that push in from the south, around the mountains’ shelter.
For the weather across the whole of Maui, read our Maui weather guide:
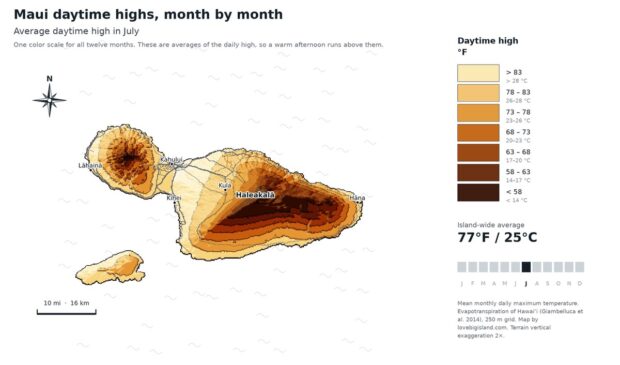
Maui Weather by Month: Which Side to Stay On
Kīhei gets rain on 36 days a year, Hāna on 267. How Maui weather works month by month, what a rain percentage really means, and which coast to pick.
Monthly average Lāhainā weather: temperature, rainfall and cloud cover
Monthly average temperatures in Lāhainā run from 71°F (22°C) in February to 78°F (26°C) in August, with September and October just behind August.
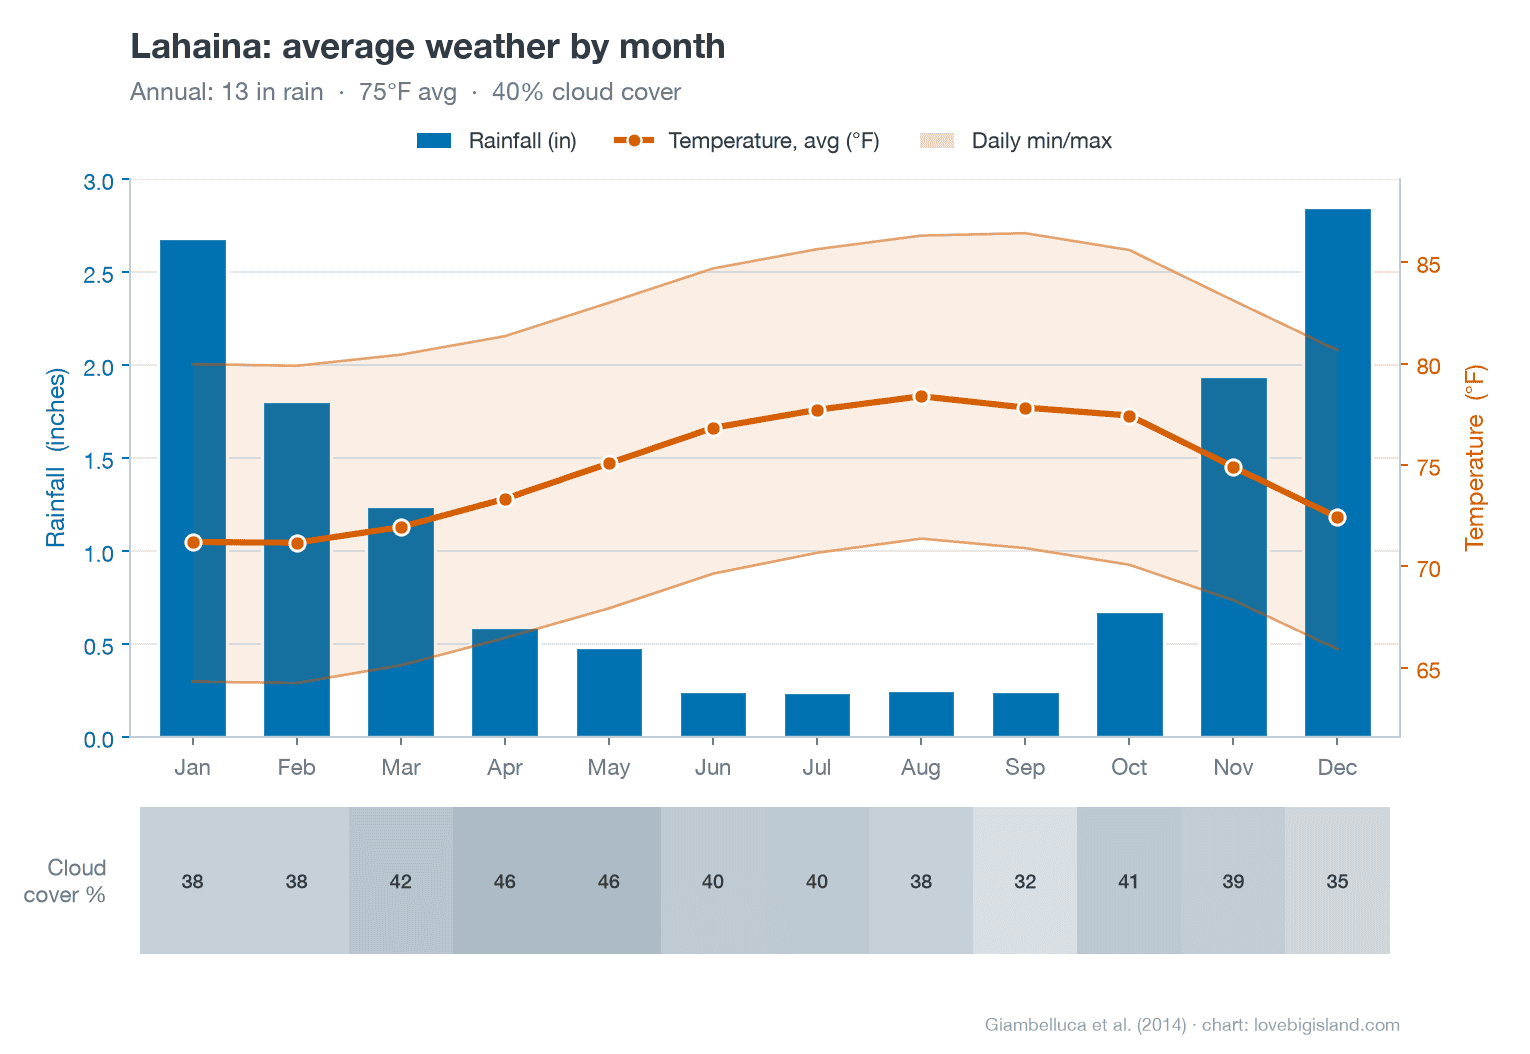
Those are whole-day averages. Within a day the temperature swings about 15°F. The average daily high runs 80 to 86°F and the average daily low 64 to 71°F. The warmest afternoons come in September, when the average high tops out at 86°F, a month after the warmest whole-day average in August.
December is the wettest month at 2.8 inches, and June through September each average about a quarter inch. Cloud cover averages 40% across the year, cloudiest in May at 46%. September is both the clearest month and one of the driest, at 32% and 0.25 inches.
Lāhainā rainfall: seven times as much 5.4 miles inland
The gauge in Lāhainā town, 38 feet above sea level, averaged 14.63 inches of rain a year over 1949 to 2011. 5.4 miles away and 2,980 feet up the West Maui Mountains, the Haelaau gauge averaged 105.12 inches over the identical stretch of years. Launiupoko Intake, 1,280 feet up and 3.9 miles from town, sits between them at 49.12 inches on that same record.
Rainfall keeps rising above Haelaau. The University of Hawaiʻi’s station atlas, working from a single 1978 to 2007 base period, puts Wahikuli at 580 feet on 18.51 inches a year and Puʻu Kukui at 5,771 feet on 365.86, a twenty-fold difference within the same 1978 to 2007 period.
On that same atlas period, Honolua at 200 feet reads 44.31 inches while Wahikuli at 580 feet reads 18.51. The higher station is the drier one, because the north end loses the mountains’ shelter from the trade winds.
The 13.3 inches our charts show comes from a different instrument again: a gridded point estimate from Giambelluca and colleagues’ 2014 evapotranspiration atlas, which interpolates between gauges rather than reporting one. The town gauge’s 14.63 inches is a measurement, taken over 1949 to 2011.
That rain upslope is why the water at the beach can turn brown on a day with clear skies overhead. Heavy rain in the mountains washes soil and road runoff down the streams and storm drains onto the coast, and the plume carries bacteria. If the water looks brown or cloudy, stay out of it, whether or not an advisory has been posted. Current advisories are listed by the state health department at health.hawaii.gov.
If your day runs from the beach up into the mountains, pack a rain layer you won’t need at sea level.
How often it rains in Kāʻanapali and Kapalua
Staying north of Lāhainā means more rain, and the further north you go the more of it there is. Kapalua’s gauge recorded rain on 157 days a year over 1987 to 2012. Kāʻanapali’s recorded 61 days over 1949 to 1964. Lāhainā’s own gauge recorded 33 over 1949 to 2011. Each figure comes from a different stretch of years, so read them as three station histories rather than one comparison.
Kapalua keeps getting rain through the summer. Over 1987 to 2012 each of its summer months recorded 13 to 15 rain days, against monthly totals of 1.0 to 1.6 inches. Lāhainā over its own record averages one rain day a month across those same months.
Those are light showers. Fourteen rain days against a monthly total of an inch and a half works out to roughly a tenth of an inch at a time: a passing shower on a beach afternoon. And if a wet spell does settle in, our Maui rainy day activities guide covers what to do indoors.
If you’re choosing a base on rainfall alone, the Kāʻanapali gauge holds the drier record of the two, and Kapalua’s extra rain arrives in short bursts. Kāʻanapali’s rain-day count is the least certain figure here: the station appears twice in the archive with the same annual mean but two different day counts, 61 and 87, which points to a change in how the gauge was read.
Lāhainā’s everyday wind is a sea breeze
The West Maui Mountains block the trade winds before they reach town, so the wind Lāhainā actually gets most days comes off the water instead. Saul Price named this coast among the handful of places in Hawaiʻi where that happens, in his 1983 climate chapter for the Atlas of Hawaii, alongside the Kona Coast and the ʻEwa-Waiʻanae coast of Oʻahu.
From late morning to early evening the air moves inland off the water, sometimes briskly. Overnight and until just after sunrise it drifts back out to sea so gently, in Price’s 1983 words, “that it can barely be felt”.
Plan outdoor time around that. Mornings are calm here, and the onshore breeze builds through the afternoon.
Without a steady trade wind, the afternoons run warm. The Lāhainā gauge averaged a daily high of 84.9°F over 1949 to 2011 and reached 90°F on 19.8 days a year. September is the warmest month by average high, at 88.2°F, and the record for the station stands at 97°F on August 18, 1985.
That average afternoon runs warmer than Kahului’s, which averaged 83.8°F over 1954 to 2012. Kahului crosses 90°F slightly more often, 21.1 days a year, and its nights run warmer, 67.3°F against 66.4°F. The two records also cover different years.
Pick a spot with afternoon shade.
Hourly average Lāhainā weather: air temperature and cloud cover
The sky over Lāhainā clears overnight. Cloud cover holds in the low 30s through the small hours, dips to about 30% around 8am, then builds to its 58% peak around 2pm before thinning again after sunset.
The sky over town is about twice as cloudy at 2pm as it is at 11pm, and mornings are clearer than afternoons. If a clear-sky activity is flexible, schedule it before noon.
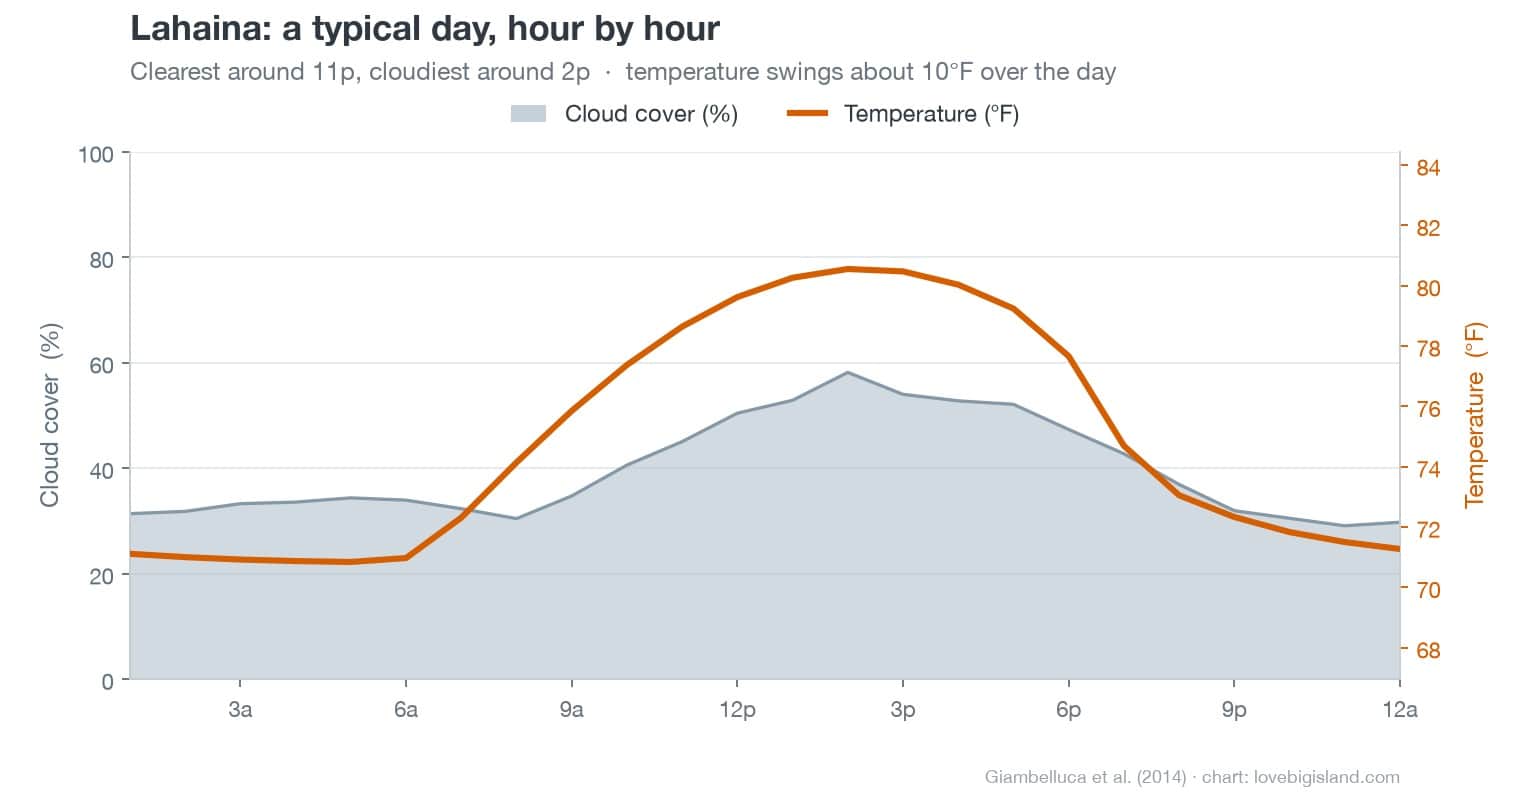
Air temperature follows the same curve, from about 71°F before dawn to 81°F in the early afternoon. That is the hourly average across all days, so it sits inside the wider daily high and low above.
Lāhainā weather forecast
Everything on this page is a long-term average. Any given day in Lāhainā can differ a lot from these numbers.
For the seven-day outlook, check the NOAA point forecast for Lāhainā.
The National Weather Service issues its forecasts by zone. Lāhainā and the whole West Maui leeward coast sit in one, Maui Leeward West.
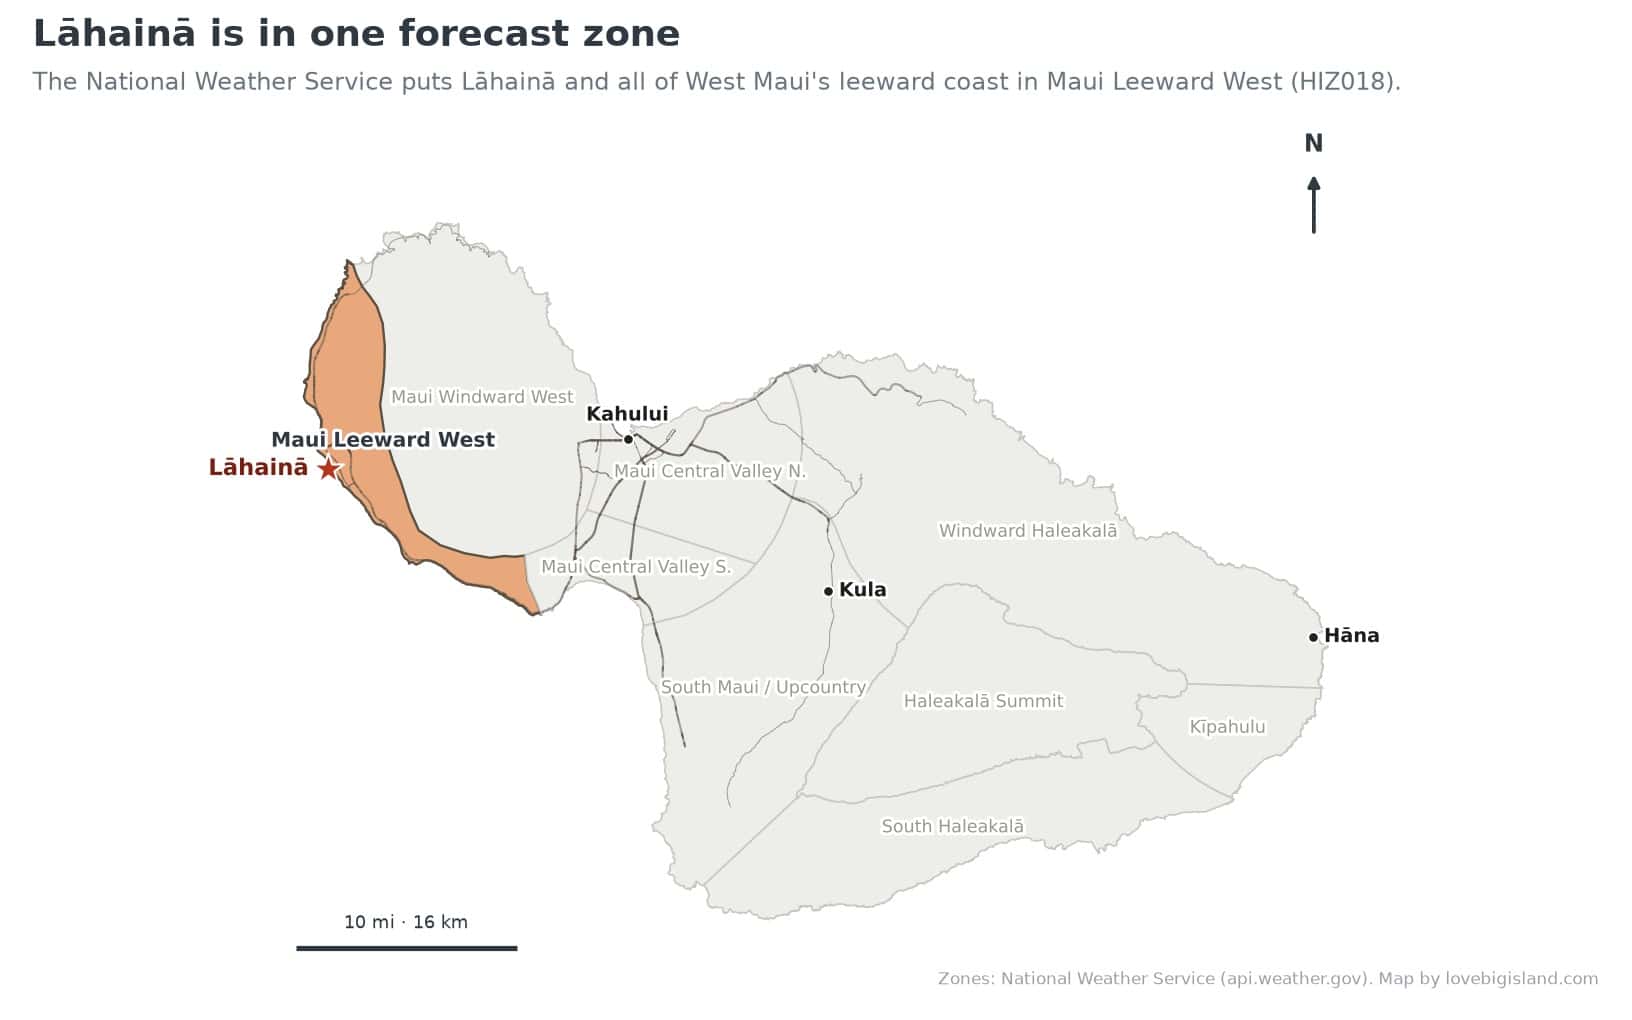
Lāhainā and all of West Maui's leeward coast sit in one National Weather Service forecast zone, Maui Leeward West (HIZ018). Zones: National Weather Service. Map by Love Big Island.
Weather summary for Lāhainā
Of the three Maui towns we chart, Lāhainā and Kīhei are nearly the same: annual averages of 74.85°F and 74.9°F, cloud cover of 40% and 39%. The difference is rain, and even that is small, 13.3 inches against Kīhei’s 11.5. Hāna’s climate is different: five times Lāhainā’s rain, with cloud cover at 64%. If your Maui days split between a West Maui base and the Hāna side, bring rain gear for that drive, though you never need it in Lāhainā. Crowds and prices move month to month too: see the best time to visit Maui.
| month | Temperature (°F) | Rainfall (in) | Cloud Frequency (%) |
|---|---|---|---|
| January | 71.20 | 2.685 | 38.19 |
| February | 71.17 | 1.807 | 37.75 |
| March | 71.94 | 1.244 | 42.28 |
| April | 73.33 | 0.594 | 45.62 |
| May | 75.08 | 0.486 | 45.69 |
| June | 76.83 | 0.249 | 40.18 |
| July | 77.72 | 0.242 | 40.32 |
| August | 78.39 | 0.253 | 37.72 |
| September | 77.83 | 0.250 | 32.04 |
| October | 77.44 | 0.678 | 40.79 |
| November | 74.90 | 1.940 | 39.14 |
| December | 72.42 | 2.848 | 35.34 |
| Annual | 74.85 | 13.276 | 39.59 |
Sources and methods
- Monthly and hourly temperature, rainfall and cloud: Lāhainā’s own point in the University of Hawaiʻi 250-metre atlas grid, from Giambelluca et al. (2014), Evapotranspiration of Hawaiʻi, via the Rainfall Atlas of Hawaiʻi. Annual figures are gridded estimates that interpolate between gauges.
- Rain-day count: Western Regional Climate Center period-of-record summary for the Lāhainā gauge, 1949–2011.
- Forecast zone: National Weather Service public forecast zones (api.weather.gov).
- Explore the data yourself: the UH Hawaiʻi Climate Data Portal publishes interactive climate maps, live readings from the Hawaiʻi Mesonet station network (live data), and monthly climate summaries.