
It rains in Līhuʻe on 193 days in an average year, and almost none of it will cost you a beach day. Two thirds of those days leave less than a tenth of an inch before the sky clears again, and the whole year adds up to about 36 inches, about half of what Princeville collects on the north shore. Kapaʻa, twenty minutes up the same coast, gets the same weather.
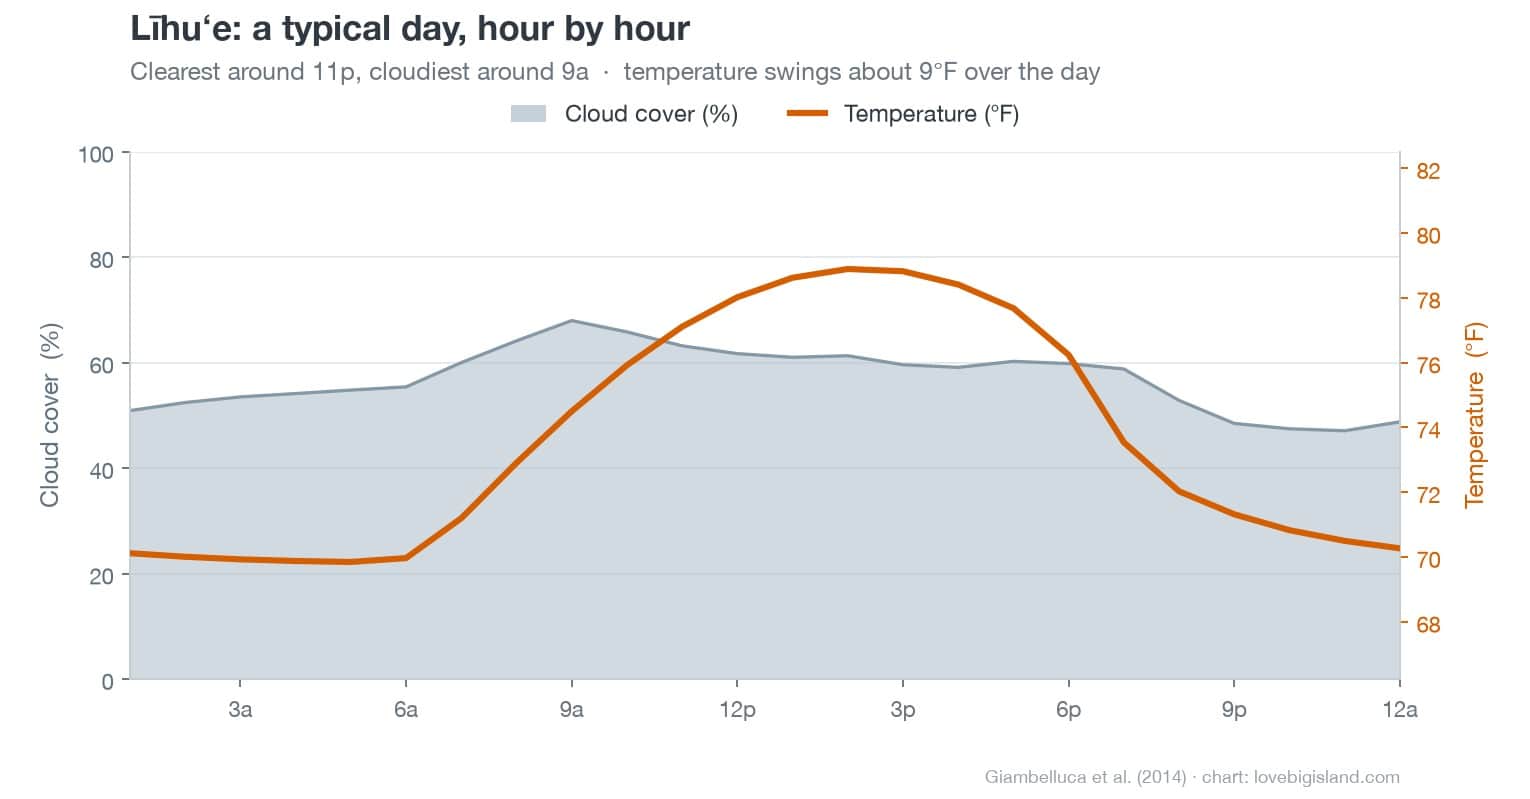
If you’re staying on Kauaʻi’s east side, the question is timing: which months are driest, and why a grey July forecast should not scare you off. Showers peak around dawn. By mid-afternoon the sky is as clear as the daylight hours get, so plan a slow morning and a beach afternoon. If a morning does wash out, our Kauaʻi rainy day activities guide has indoor picks.
Table of contents
Best time to visit Līhuʻe and Kapaʻa
September is the east shore’s best month: the clearest skies of the year on 2.18 inches of rain. The wider window is June through September, when monthly rain runs under two and a half inches and daytime highs sit in the mid-80s. March is the month to plan around, with the year’s most rain, and whale season runs December into March.
Līhuʻe and Kapaʻa at a glance
Each card jumps to the section that explains it.
The biggest number on the cards, 193 rain days, is also the mildest: most of those days bring only a brief shower on the trade winds.
Rain on the east shore: 193 days a year, most under a tenth of an inch
Līhuʻe records measurable rain on 193 days in an average year. Only 66 of those days reach a tenth of an inch. The other 127 are the east side’s signature weather: a shower carried in on the trade winds that drops a few hundredths of an inch and is gone within minutes. The average wet day here delivers 0.19 inches of rain.
July is the extreme month: the most rain days of the year, 19, and the least rain, 1.75 inches. Book a July week on the east shore and it will probably rain most days you’re here, for a few minutes at a time, and you will still spend every afternoon on the sand.
Kīhei, the driest town on Maui’s south shore, is the exact inverse: 32 rain days a year to Līhuʻe’s 193, on roughly a third of the rain. Kīhei collects its smaller total in a few winter storms; Līhuʻe spreads three times the rain across six times as many days.
Big rainstorms do land here, mostly November through March. Līhuʻe’s biggest recorded day is 11.24 inches on December 1, 1968, about a quarter of an annual total in 24 hours, and a January 1956 storm put 11 to 13 inches on east-shore gauges in a day. Those are the days the streams run brown, which matters at the beach: see brown water below.
The east-shore rain clock: showers at dawn, clearest by mid-afternoon
The showers here run on a schedule. In a full year of hourly airport observations, a 5 a.m. hour carried measurable rain 16% of the time; a 5 p.m. hour, under 5%. Low cloud follows the same curve: a ceiling under 3,000 feet sits over the airport a third of the time before dawn and about a tenth of the time at 2 p.m.
So a drizzly 7 a.m. in Kapaʻa says nothing about your afternoon, and the best beach hours on this coast run from about 2 p.m. into early evening.
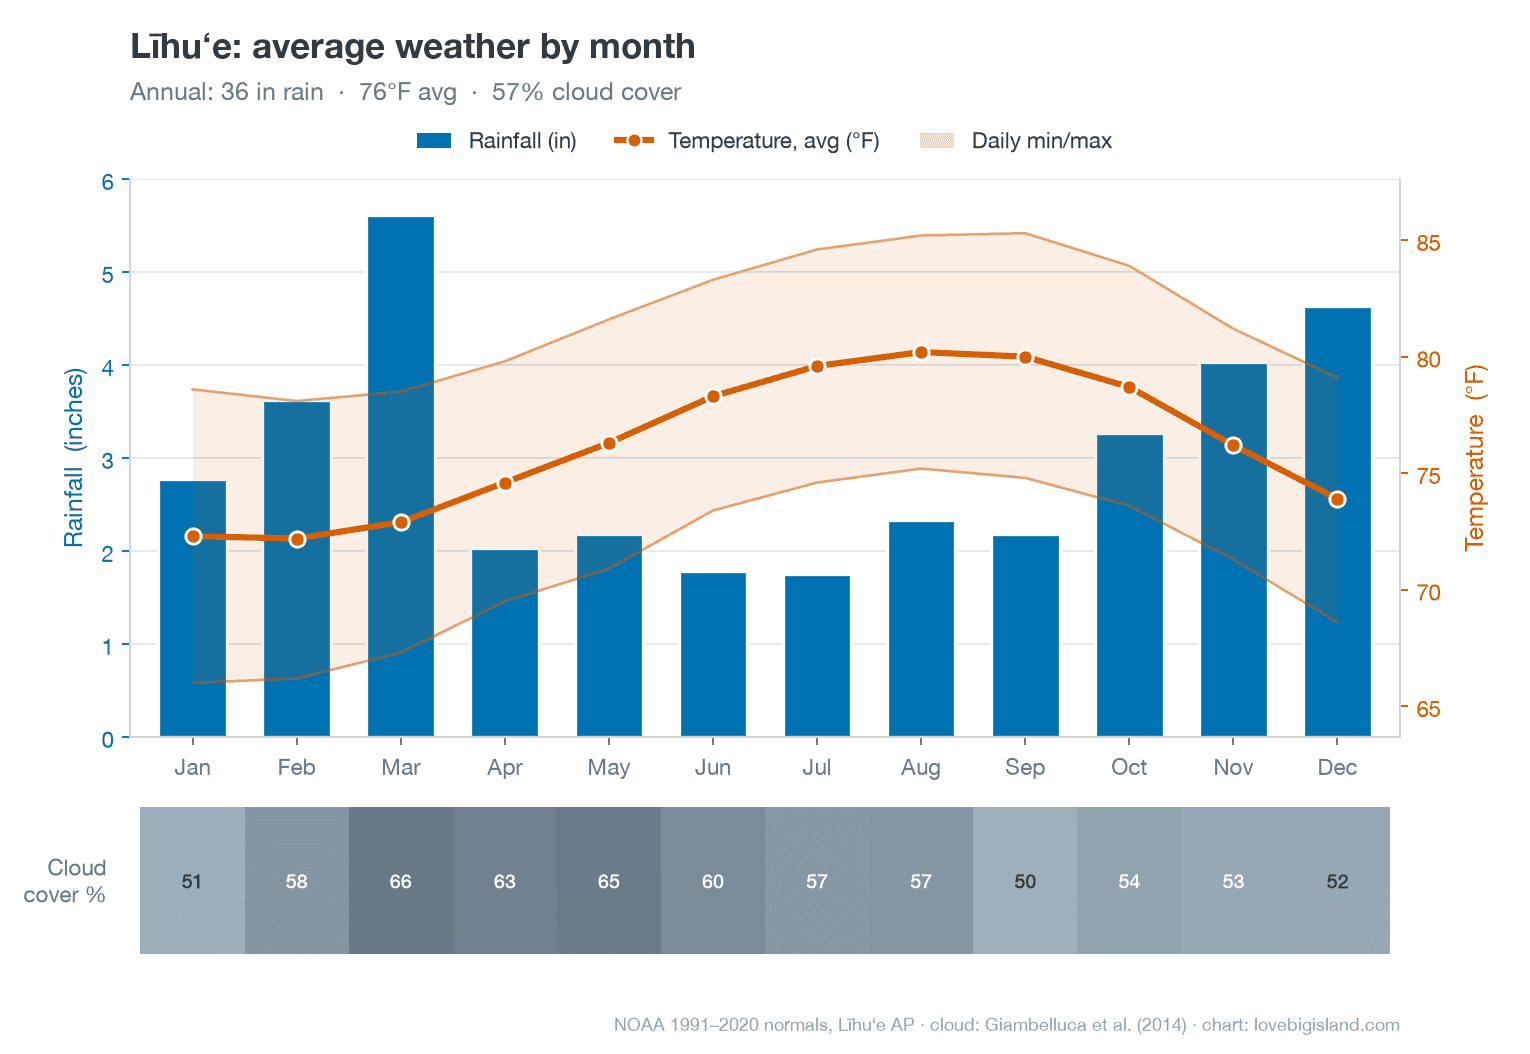
Month by month in Līhuʻe: temperature, rainfall, and cloud
Līhuʻe’s temperatures barely move. Daytime highs run from 78 °F in midwinter to 85 in late summer, nights from 66 to 75, and the monthly average swings just 8 degrees across the whole year: a swing first published by the state climatologist in 1983 that has not moved since. The all-time high at the airport is 91 °F, reached once in 63 years of record, and the old coastal gauge at Kapaʻa never touched 90 at all.
You’ll feel the humidity more than the heat: the same trade-wind air that carries the showers keeps summer afternoons in the mid-80s while leeward Waimea, across the island, logs ten 90-degree days a year.
| Month | Temperature (°F) | Rainfall (in) | Cloud cover (%) |
|---|---|---|---|
| January | 79 / 66 | 2.78 | 51 |
| February | 78 / 66 | 3.63 | 58 |
| March | 79 / 67 | 5.61 | 66 |
| April | 80 / 70 | 2.03 | 63 |
| May | 82 / 71 | 2.18 | 65 |
| June | 83 / 73 | 1.79 | 60 |
| July | 85 / 75 | 1.75 | 57 |
| August | 85 / 75 | 2.33 | 57 |
| September | 85 / 75 | 2.18 | 50 |
| October | 84 / 74 | 3.27 | 54 |
| November | 81 / 71 | 4.03 | 53 |
| December | 79 / 69 | 4.64 | 52 |
| Annual | 82 / 71 | 36.22 | 57 |
Temperature and rainfall: NOAA 1991–2020 climate normals, Līhuʻe Airport (in town). Cloud cover: Līhuʻe’s point in the UH 250 m atlas grid (Giambelluca et al. 2014), a gridded estimate.
Līhuʻe Airport to Waiʻaleʻale: ten times the rain in twelve miles
The mountain filling the skyline behind Līhuʻe is Waiʻaleʻale, the wettest gauged point on Kauaʻi and one of the wettest places on earth. The transect reads: 40 inches a year at the airport, 161 at the Wailua ditch intakes at 1,100 feet, 394 at the summit.
That is ten times the airport’s rain in under twelve miles, about 30 inches of annual rainfall per mile, and the summit gauge reads 2.3 times the next-wettest station on the island.
The trades stack their moisture against that wall all day, and the coast below keeps its light-shower pattern: the heavy rain stays on the mountain. The full Waiʻaleʻale story, including why no modern gauge reproduces the famous 486-inch “wettest place on earth” figure, is on our Kauaʻi weather hub.
Beach days and ocean conditions on the east shore
The east shore is Kauaʻi’s windward coast, and its beach weather rates below the south and west shores: more cloud, more passing showers, choppier water. Kalapakī, the shore’s main swimming beach, scores 2 of 5 stars on our Kauaʻi beach-weather map, 38 out of 100, against Poʻipū’s 58.
September is Kalapakī’s best month, and in every month the clearest window is mid-afternoon into early evening, the same clock the showers follow. Two things can spoil a swim on an otherwise fine day: wind chop and brown water.
Wind and surf
The same around-the-clock trades that never give this coast a calm morning keep the open east-shore water textured most days: short-period wind chop and whitecaps by midday, with none of the glassy dawn windows leeward coasts get. Swimmers do best in the protected spots, Kalapakī inside Nāwiliwili’s breakwater and Lydgate’s boulder-ringed pools, and surfers get their season in winter.
Check the National Weather Service surf-zone forecast before swimming an open beach; there is no wave buoy off this shore, so the forecast is the best information that exists.
Brown water
Brown water is storm runoff: soil and debris washed out of the streams after rain on the mountain, and this coast’s stream mouths drain the slopes below Waiʻaleʻale. The state’s guidance is appearance-based and simple: avoid swimming during or right after heavy rain, and stay out of water that looks brown or murky whether or not an advisory has been posted, until it clears.
At Hanamāʻulu Bay murky is the everyday state, not a storm signal, so don’t use that bay to judge the rest of the coast. Advisories are posted on the state Department of Health’s water-quality map.
Sources and methods
- Rainfall and temperature (the cards, the monthly table, the climograph’s rain bars and temperature line, and every rain-day figure): NOAA 1991–2020 climate normals for Līhuʻe Airport, the station in town. The 63-year record at the same field (Western Regional Climate Center, 1950–2012) reads the same shape on more rain: 198 wet days, 40.93 inches, with the wettest stretch November through January rather than the normals’ March. The two are never averaged. The Kīhei comparison uses the same NOAA product and period on both sides.
- Records and extremes (91 °F once in 63 years; the 11.24-inch day; Kapaʻa’s never-90): WRCC period-of-record summaries, Līhuʻe WSO AP 1950–2012 and Kealia 1112 (the Kapaʻa-coast gauge) 1949–1987. No temperature record of any kind exists for Kapaʻa or Wailua today; Kealia’s 1949–1987 record is the coast’s last thermometer.
- Cloud cover (the table’s cloud column, the climograph’s cloud strip, and the hour-by-hour chart): Līhuʻe’s point in the University of Hawaiʻi 250-metre atlas grid (Giambelluca et al. 2014), a gridded estimate.
- The rain clock and the around-the-clock trades: hourly airport observations (METAR) at Līhuʻe Airport, calendar year 2024, computed for this page. One year at one station: a sample that shows the daily shape, not a 30-year climatology.
- The Waiʻaleʻale transect: the UH Rainfall Atlas station table, 1978–2007 base period, one product end to end (airport 39.96 in, Wailua Ditch 161.09, summit 393.86); the summit’s 2.3× ranking is against the 60 Kauaʻi stations with a complete annual mean in that table. The steeper 118-inches-per-mile figure is Saul Price’s (Atlas of Hawaii, 1983), quoted as his. The summit’s four published annual figures span 374 to 486 inches across four sources and periods, which is why this page ranks it only within Kauaʻi.
- Beach-weather map (the Kalapakī rating): each beach scored from 30-year monthly rainfall and cloud cover in the UH 250 m atlas grids. The full map is on the Kauaʻi weather hub.
- Surf and brown water: NWS Honolulu surf-zone forecast; Hawaiʻi Department of Health Clean Water Branch brown-water guidance and advisories.
- Explore the data yourself: the UH Hawaiʻi Climate Data Portal publishes interactive climate maps, live readings from the Hawaiʻi Mesonet station network (live data), and monthly climate summaries.