One island runs from a beach at sea level to snow near 13,800 feet, and from 9 inches of rain a year to nearly 200, close to a twenty-fold spread in rainfall. Where you stay on the Big Island decides your weather far more than when you visit.
This page is for anyone deciding where to base a Big Island trip. Hilo, on the windward east, is one of the wettest cities in the country. Waikoloa, 60 miles west, is drier than parts of the Sonoran Desert. Between them stand Mauna Kea and Mauna Loa, both dusted with snow most winters. Pick your coast and your elevation first.
Table of contents
- The best time to visit the Big Island
- Month by month: temperature, rainfall, and cloud
- How the trade winds shape local weather
- Weather by region: Kona, Kohala, Hilo, and the summits
- Beach days and ocean conditions
- Vog and air quality
- Sources and methods
The best time to visit the Big Island
For weather alone there is no bad month, only a right coast: Kona and the Kohala resorts stay warm and dry year round, while Hilo and Volcano are green and showery in every one. The drier stretch island-wide runs from late spring into fall. Prices and crowds move more than the weather does, and our full guide to the best time to visit the Big Island works through those month by month.
Hurricane season runs June through November, though a direct hit is rare. Our Hawaiʻi weather overview covers the season, and how the islands compare, in full.
The island at a glance
The extremes worth knowing before you pick a base: the wettest and driest coasts, the warmest beaches, the coldest summits, and where the beach-day odds run highest. Each card jumps to the detail below.
Month by month: temperature, rainfall, and cloud
Winter is the wetter half almost everywhere, summer the drier, but that seasonal swing stays small next to the gap between the coasts. Temperature, rainfall, and cloud each shift a little through the year, and the three maps here track them across the island, month by month.
Daytime warmth barely changes at sea level
At the coast the whole year spans only a few degrees. Kona averages 84°F highs and Hilo 81, and Hilo’s spread between its coolest and warmest month is only about 5°F (Saul Price, Atlas of Hawaiʻi climate chapter, 1983). Elevation, not season, is what cools the air: reckon roughly 3 to 4 degrees lost per thousand feet, so Volcano at 4,000 feet runs 12 to 16 degrees below the coast, and the summits sit near or below freezing.
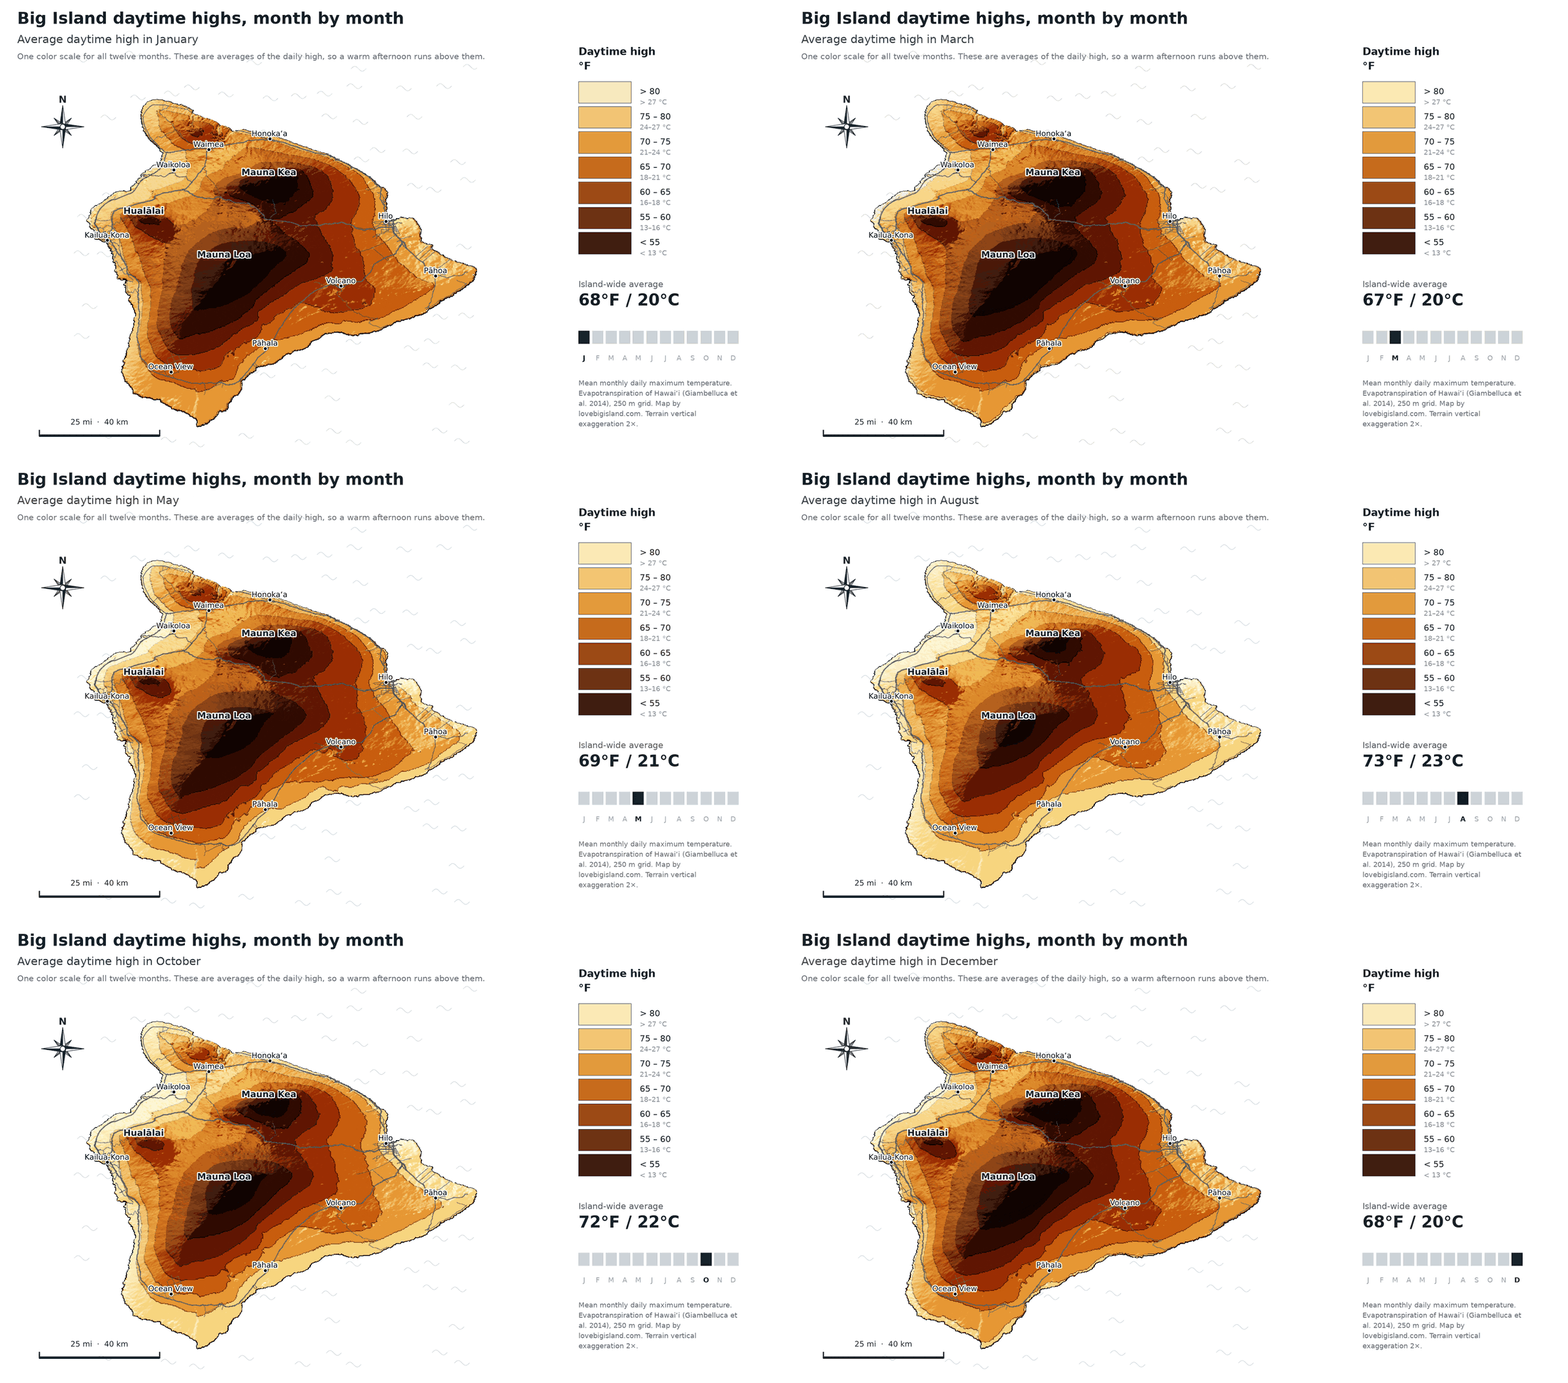
Average daytime high for each month, draped over the island’s terrain. Every month uses the same color scale, so any two months can be compared directly. These are monthly averages of the daily high, so a warm afternoon runs above them. Data: Evapotranspiration of Hawaiʻi (Giambelluca et al. 2014), 250 m grid. Map by Love Big Island.
Rainfall: it’s all about which slope you’re on
Averaged over the island the wet season peaks in winter, but the number that matters is where the rain lands. The windward east and the 2,000-to-4,000-foot slopes catch the heaviest totals, close to 200 inches a year in the wettest spots above Hilo. The leeward Kona and Kohala coasts stay in single or low double digits, under 10 inches at Waikoloa. The wettest slopes get more rain in a single month than the driest coast gets all year.
| Place | in / yr | mm / yr | Setting |
|---|---|---|---|
| Hilo | 142 | 3,610 | Windward coast at the base of the slope |
| Pāhoa | 129 | 3,280 | Windward Puna |
| Volcano | 120 | 3,050 | Upslope, 4,000 ft |
| Honokaʻa | 92 | 2,340 | Windward Hāmākua coast |
| Nāʻālehu | 48 | 1,220 | Kaʻū lowlands, south end |
| Waimea (Kamuela) | 37 | 940 | Uplands between Kohala and Mauna Kea |
| Kailua-Kona | 27 | 690 | Leeward town, above the coast |
| Keāhole (Kona airport) | 10 | 250 | Leeward lava coast |
| Waikoloa | 9 | 230 | Driest resort coast on the island |
Those are the annual figures. The map below plays the same rainfall out month by month on one fixed scale: watch the windward east stay wet in every frame while the Kona coast barely registers.
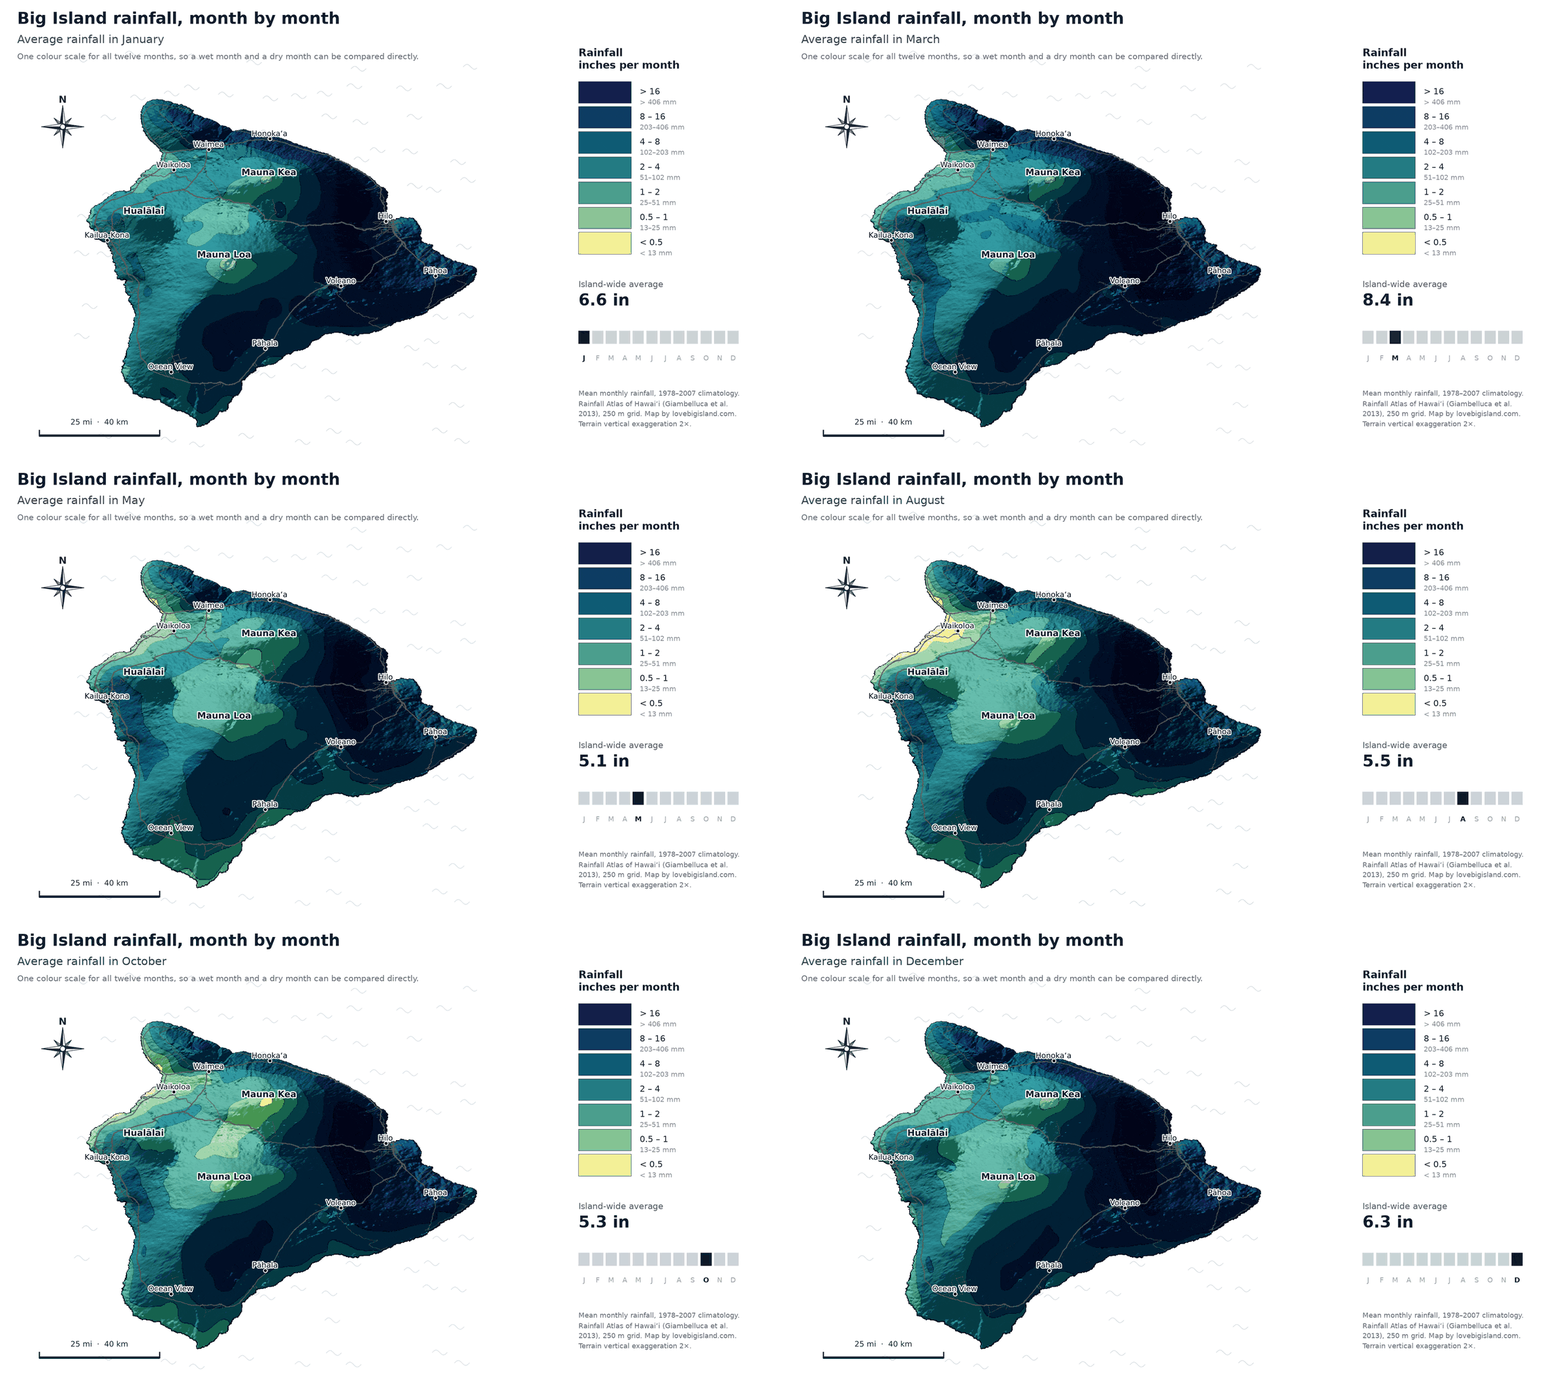
Average rainfall for each month, draped over the island’s terrain. All twelve months share one color scale, so a wet month and a dry month can be compared directly. March averages 8.4 inches across the island, June 4.3. The wet and dry sides stay put all year; only the amount of rain changes. Data: Rainfall Atlas of Hawaiʻi (Giambelluca et al. 2013), 250 m grid. Map by Love Big Island.
Cloud and sun
The clearest skies on the island sit in two very different places: the leeward Kona and Kohala coast, and the summits above the trade-wind inversion. The cloudiest band wraps the windward slopes at 2,000 to 4,000 feet. Mornings are the clear window on the Kona side; afternoon sea breezes build cumulus up the slope by early afternoon.
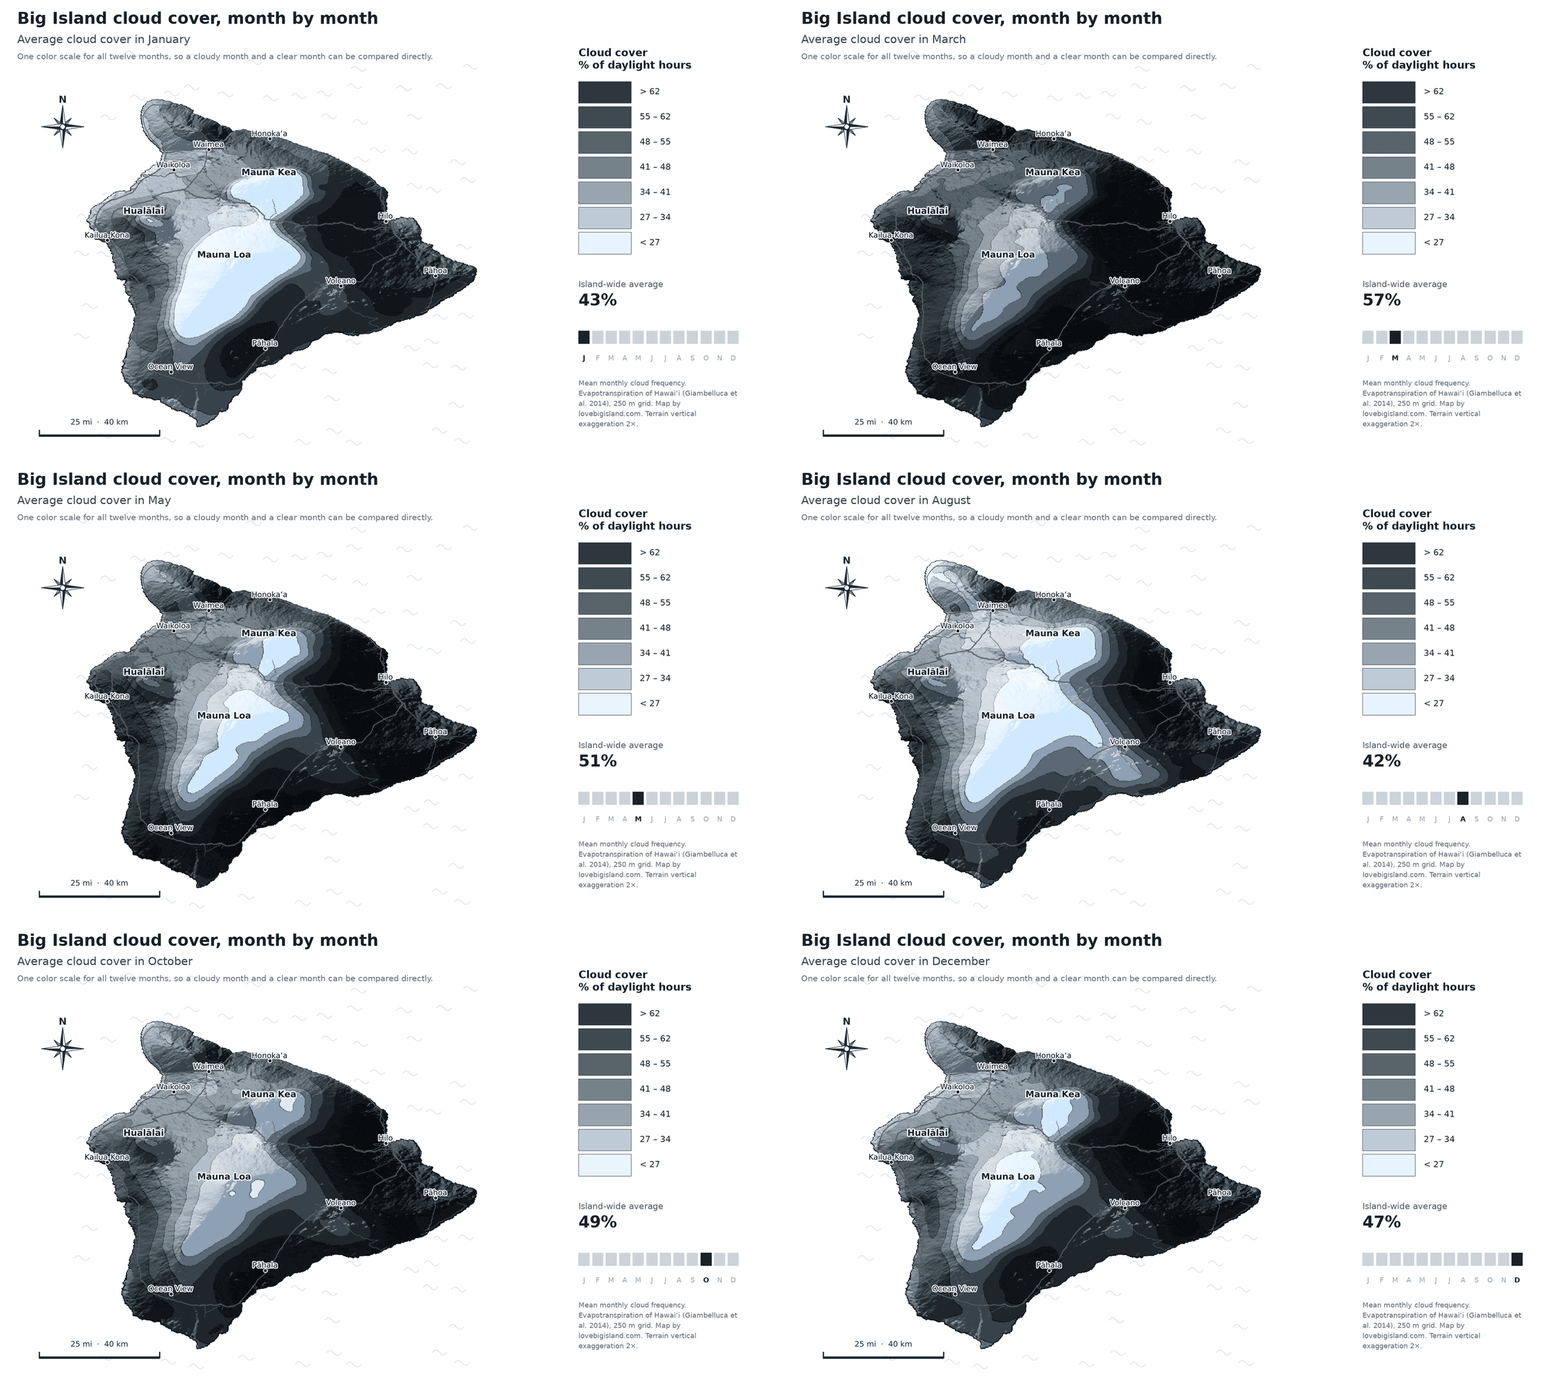
Average cloud cover for each month, on the island’s terrain. All twelve months share one color scale, so a cloudy month and a clear month can be compared directly. March averages 57% across the island, September 41%. The clearest ground of all is the high summits and the saddle, which sit above the cloud layer at about 25%. Data: Evapotranspiration of Hawaiʻi (Giambelluca et al. 2014), 250 m grid. Map by Love Big Island.
How the trade winds shape local weather
The trades arrive from the east and northeast and climb the windward slopes, dropping their rain on the way up and sliding down the leeward side dry. On the Big Island a second mechanism stacks on top: a trade-wind inversion, a stable layer usually between 5,000 and 7,000 feet, present most of the time. Below it the air is moist and cloudy; above it the air is dry and clear. That is why the very high slopes and the two summits are among the driest, clearest places on the island, and why Mauna Kea stays cool and dry from about 7,000 feet up.
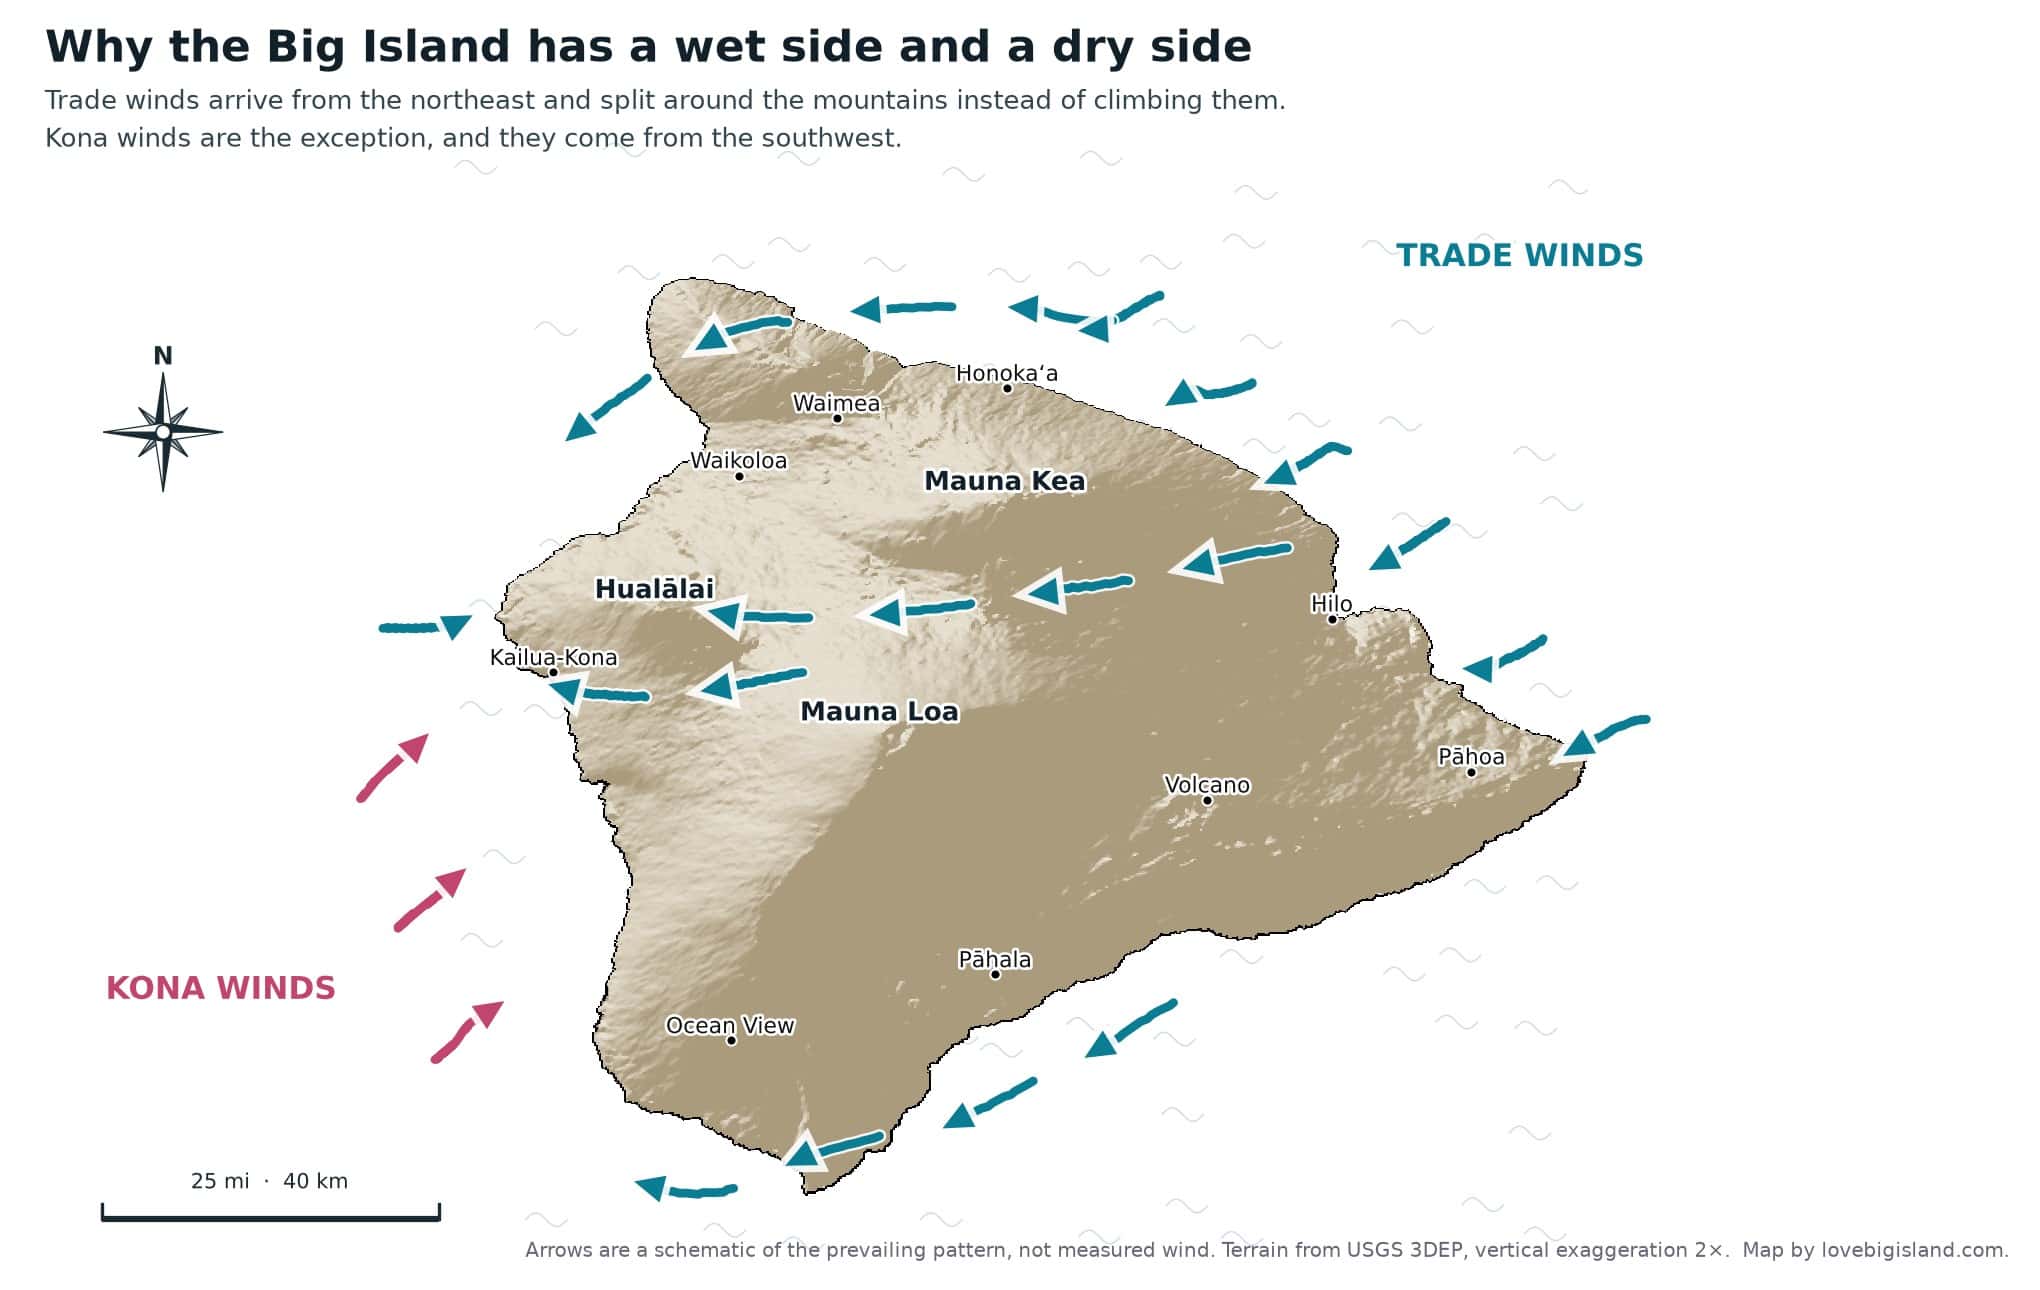
Trade winds arrive from the northeast almost year round, as a broad front rather than from any one point. They split around Mauna Kea and Mauna Loa instead of climbing them, so the windward side stays wet and Kona sits in the lee. Kona winds are the exception and come from the southwest. The arrows show the prevailing pattern rather than measured wind. Terrain from USGS 3DEP. Map by Love Big Island.
Read more about the 8 climate zones on the Big Island, which this wet-dry, high-low split creates.
Weather by region
The four below cover most visitors. If you’re staying higher up, we have the same month-by-month detail for Volcano, up near 4,000 feet, and Waimea, in the uplands between Kohala and Mauna Kea.
Kona: the dry, sunny coast
Kona sits on the island’s beach-weather coast, warm and dry and sunny, with roughly 10 inches of rain a year down at Keāhole and nearer 27 up in Kailua-Kona town. Mornings are the reliable clear window, because afternoon sea breezes ride up the slope and build cloud, and in summer the odd thunderstorm.
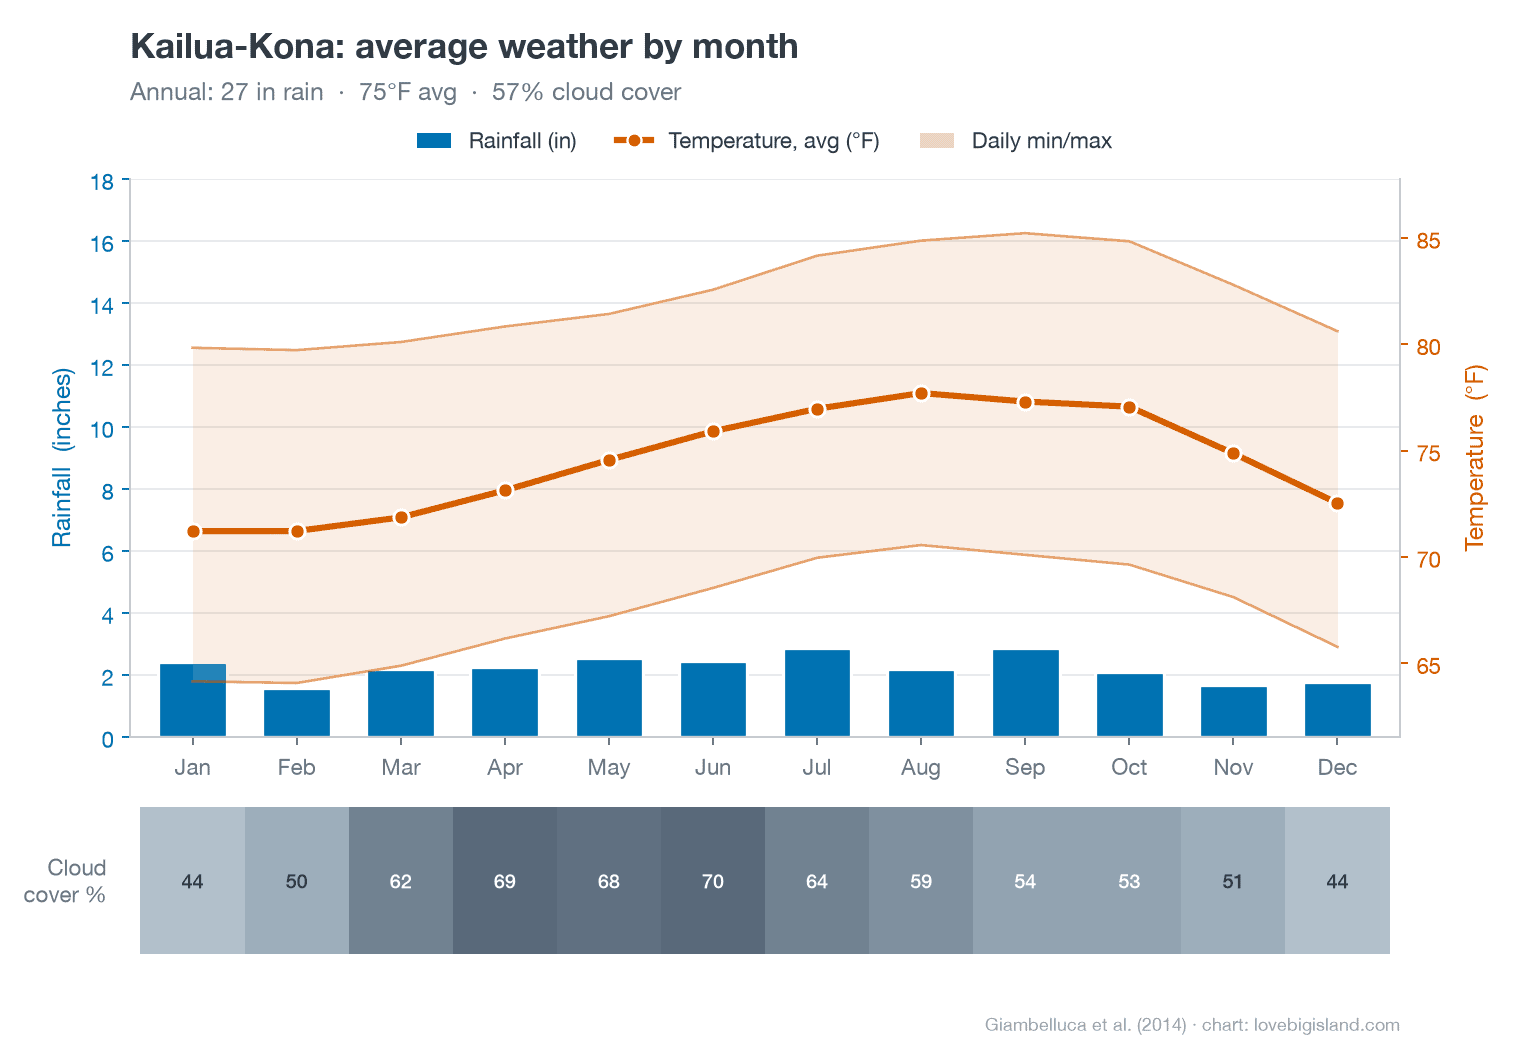
Kailua-Kona on the same 0 to 18 inch rainfall scale used for Hilo. The bars are the thin slivers they should be: Kona averages about 27 inches a year. Data: Giambelluca et al. (2014), Climate of Hawaiʻi. Chart by Love Big Island.
Month by month, our Kailua-Kona weather page has the full detail.
Kohala and the Waikoloa resort coast
The leeward coast north of Kona, from Waikoloa up through Mauna Lani and the Mauna Kea and Hāpuna resorts, is the island’s driest ground and the base for most Big Island beach vacations. Waikoloa Beach Resort normals just 9.4 inches of rain a year, the driest weather station on the island, under warm and reliable sun. The lava-field coast here sits in a deeper rain shadow than Kona and builds less afternoon cloud, so beach-weather odds run high in almost every month. The trade for that sun is the landscape: black lava rather than green hillside.
Month by month, our Waikoloa weather page tracks the resort coast hour by hour.
Hilo: the rainiest city in the United States
Hilo earns the title on how often it rains, not how hard. On the 1991 to 2020 airport normal it logs 273 days a year with measurable rain, about three in four, and totals 120 inches. A couple of Alaska towns get more total rain, so the title is about rain days, not inches. Most of those days are light, and the showers clear within the hour, and you get green hills year round with a waterfall in every gulch. Hilo has no dry season: its driest month still normals over 7 inches.
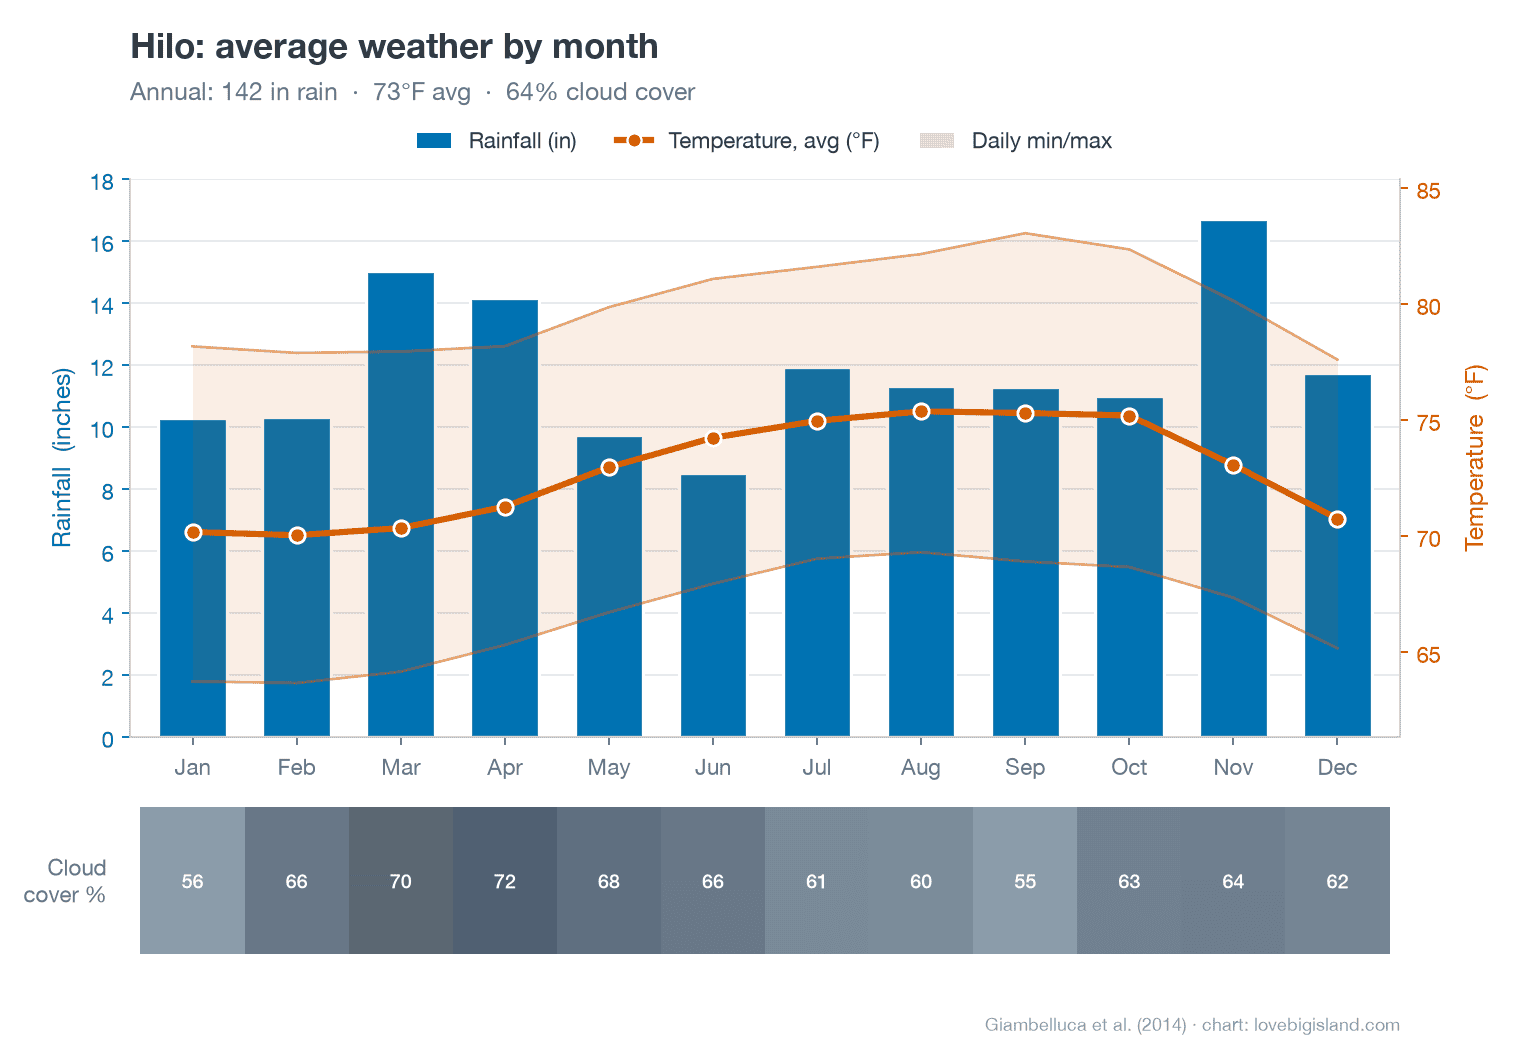
Hilo, average weather by month. The rainfall bars use a 0 to 18 inch scale: Hilo averages 142 inches a year on the UH grid, between the 120-inch airport gauge and the 151 up the slope. Data: Giambelluca et al. (2014), Climate of Hawaiʻi. Chart by Love Big Island.
Month by month, our Hilo weather page has the full detail.
The summits: snow, cold, and thin air
Mauna Kea and Mauna Loa both rise near 13,800 feet, and both see snow most winters, generally above 11,000 feet and most likely between October and April. The NWS puts daytime highs in the 50s and 60s at the summits and overnight lows in the 30s and 40s, colder in a storm, and the mountain is dry as well as cold above the inversion.
Two practical points if you drive up Mauna Kea: past the Visitor Information Station at 9,200 feet the road is steep gravel and closed to two-wheel-drive vehicles, and at 14,000 feet there is about 40 percent less oxygen than at sea level. Acclimatize at the Visitor Information Station before heading higher, and skip the summit if you are pregnant, bringing young children, or have a heart or lung condition.
Beach days and ocean conditions
The leeward Kona and Kohala coast gives you the most beach days, dry and bright most of the year, while the windward east catches trade showers in every month. High surf and brown water can both spoil a swim on an otherwise sunny day, and neither shows up in a weather forecast.
Beach days
The Big Island’s beach weather changes more from coast to coast than from day to day. Which coast you pick decides your odds of a clear afternoon. Thirteen of them rate below.
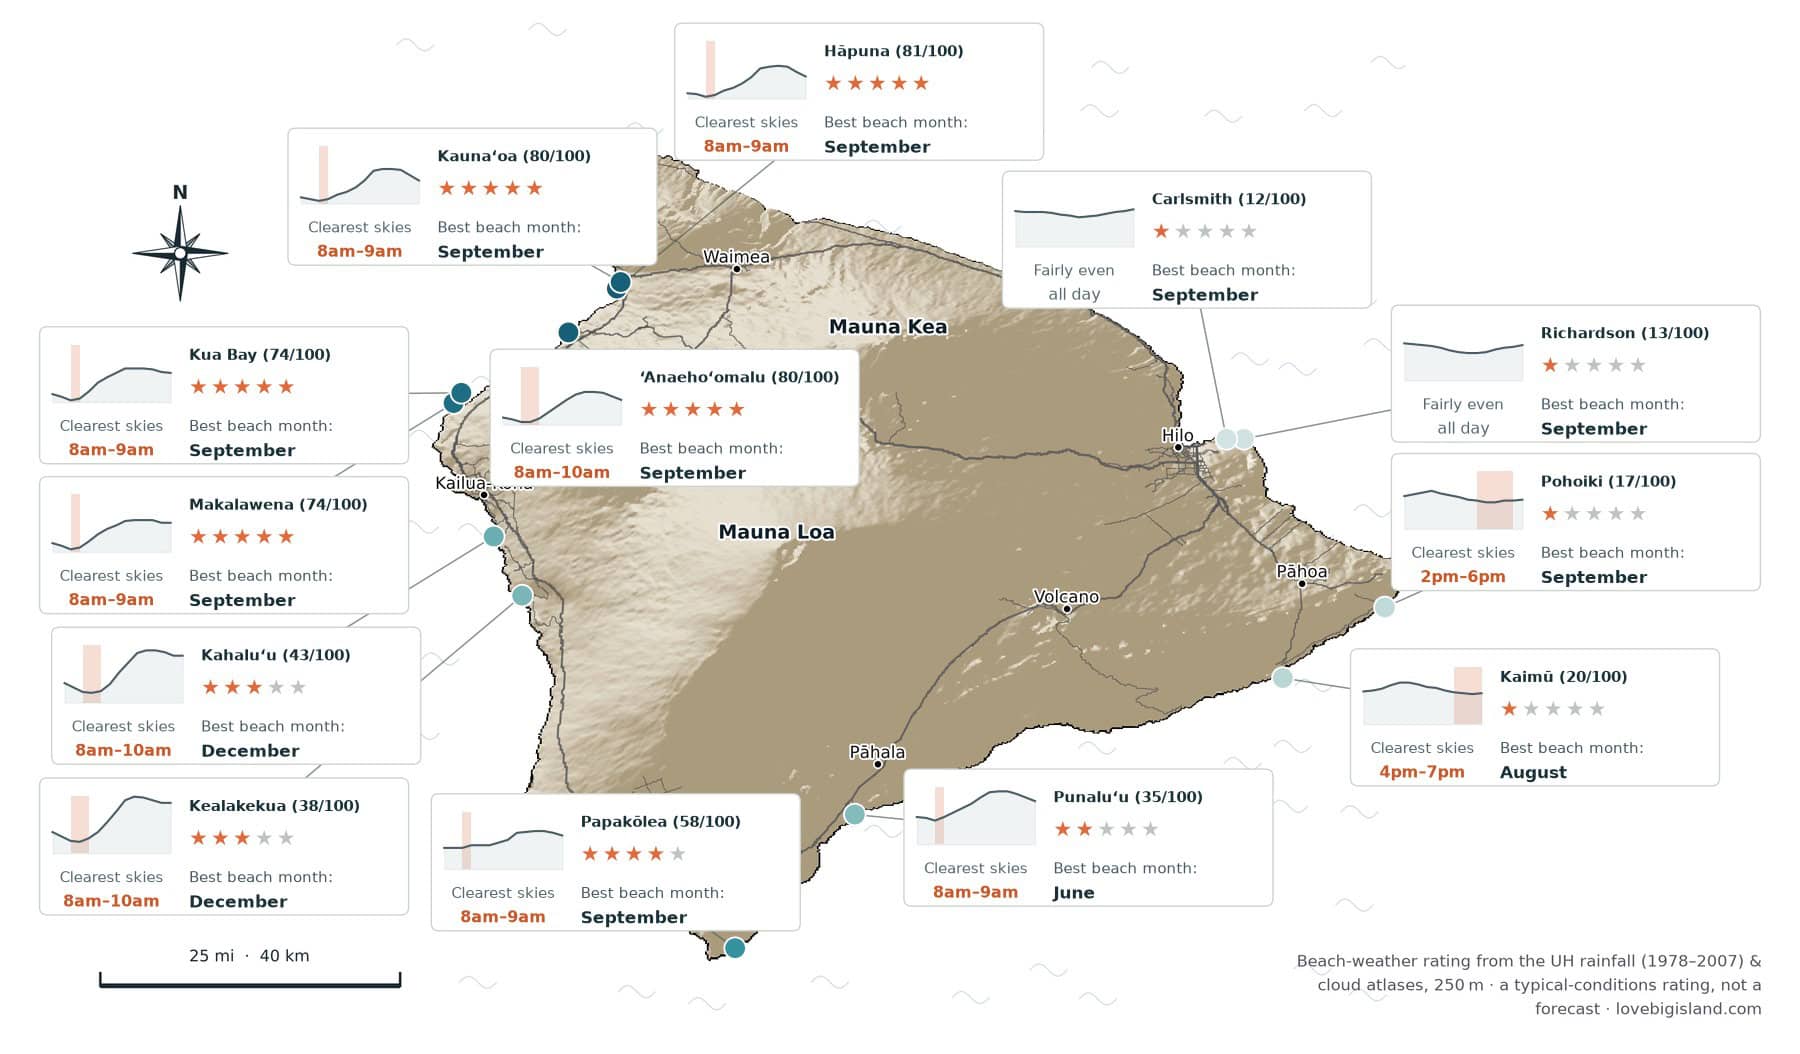
A beach-weather rating for thirteen Big Island beaches, deep blue for the best. Each card marks the beach’s score out of 100, the month it’s at its best, how cloudy a typical day runs hour by hour, and the clearest hours in orange (or fairly even all day where cloud barely shifts).
The Kohala and North Kona coast comes out on top. Hāpuna, Kaunaʻoa, Kua Bay and their neighbors are dry and often clear, at their best in September. Kailua-Kona rates a step lower because the slope clouds over through the afternoon, so go in the morning. The windward Hilo and Puna beaches are the wettest and cloudiest on the island, and the little clear sky they get comes in the early afternoon rather than the morning. Punaluʻu and the Kaʻū green-sand beach sit in between.
How we rate the beach days
We rate each beach on how many good beach hours you can count on. Two things set the score: how much rain falls and how cloudy the sky is, averaged month by month over thirty years. The scores are relative, comparing these beaches with each other rather than promising sun on any day: a higher one means more dry, bright days over the year. The best month is the month that scores highest, when both rain and cloud bottom out.
The clearest hours come from a separate record of how cloudy it gets hour by hour through a typical day, so it tells you the best time to be on the sand: mornings on the leeward coasts, early afternoon on the windward side. Use the score to compare beaches, the best month to time each one, and the clearest hours for when to head down.
The Big Island’s beaches come in black, green, and white sand, scattered across different coasts. Our guide to Big Island beaches maps which is where, and which are safe to swim.
Brown water
Brown water is what runs off the land after heavy rain: storm runoff carrying pathogens from cesspools and septic tanks, animal waste from storm drains, sewage from overflowing manholes, and chemicals from paved runoff. It turns the nearshore water murky and brown.
The rule is simple: stay out of brown water, and out of the streams feeding it, until it clears. The Hawaiʻi Department of Health sets no waiting period, so do not trust the common 48-hour figure; that number belongs to sewage and chemical spills, not storm water. Let the department, not a clock, tell you the water is clear. Check the Clean Water Branch’s map of current beach advisories for what is posted where you are staying.
Surf
Big surf runs on a different calendar than the weather, so a calm, sunny week can still bring a rough ocean. North- and west-facing shores see the big swells in winter; south-facing shores come up in summer. A dry, sunny February week can still put large surf on the north and west coasts, so check the National Weather Service Hawaiʻi surf zone forecast for the specific shore before you get in. Our guides to Big Island surfing and snorkeling cover the breaks and the calm coves by season.
Vog and air quality
The Big Island’s one weather hazard that no other island really shares is vog, the haze that forms when sulfur dioxide from Kīlauea reacts in the air downwind. When the volcano is emitting, the summit gives off on the order of 1,000 to 5,000 tonnes of SO₂ a day. The communities from Ocean View to Hilo can meet both the gas and the fine particles; far downwind, the Kona side mostly gets the particles. Sensitive groups, children and anyone with asthma or a heart or lung condition, feel it first.
Kīlauea’s activity comes in episodes, so check the current level before a Kaʻū or Volcano visit rather than trusting any fixed number.
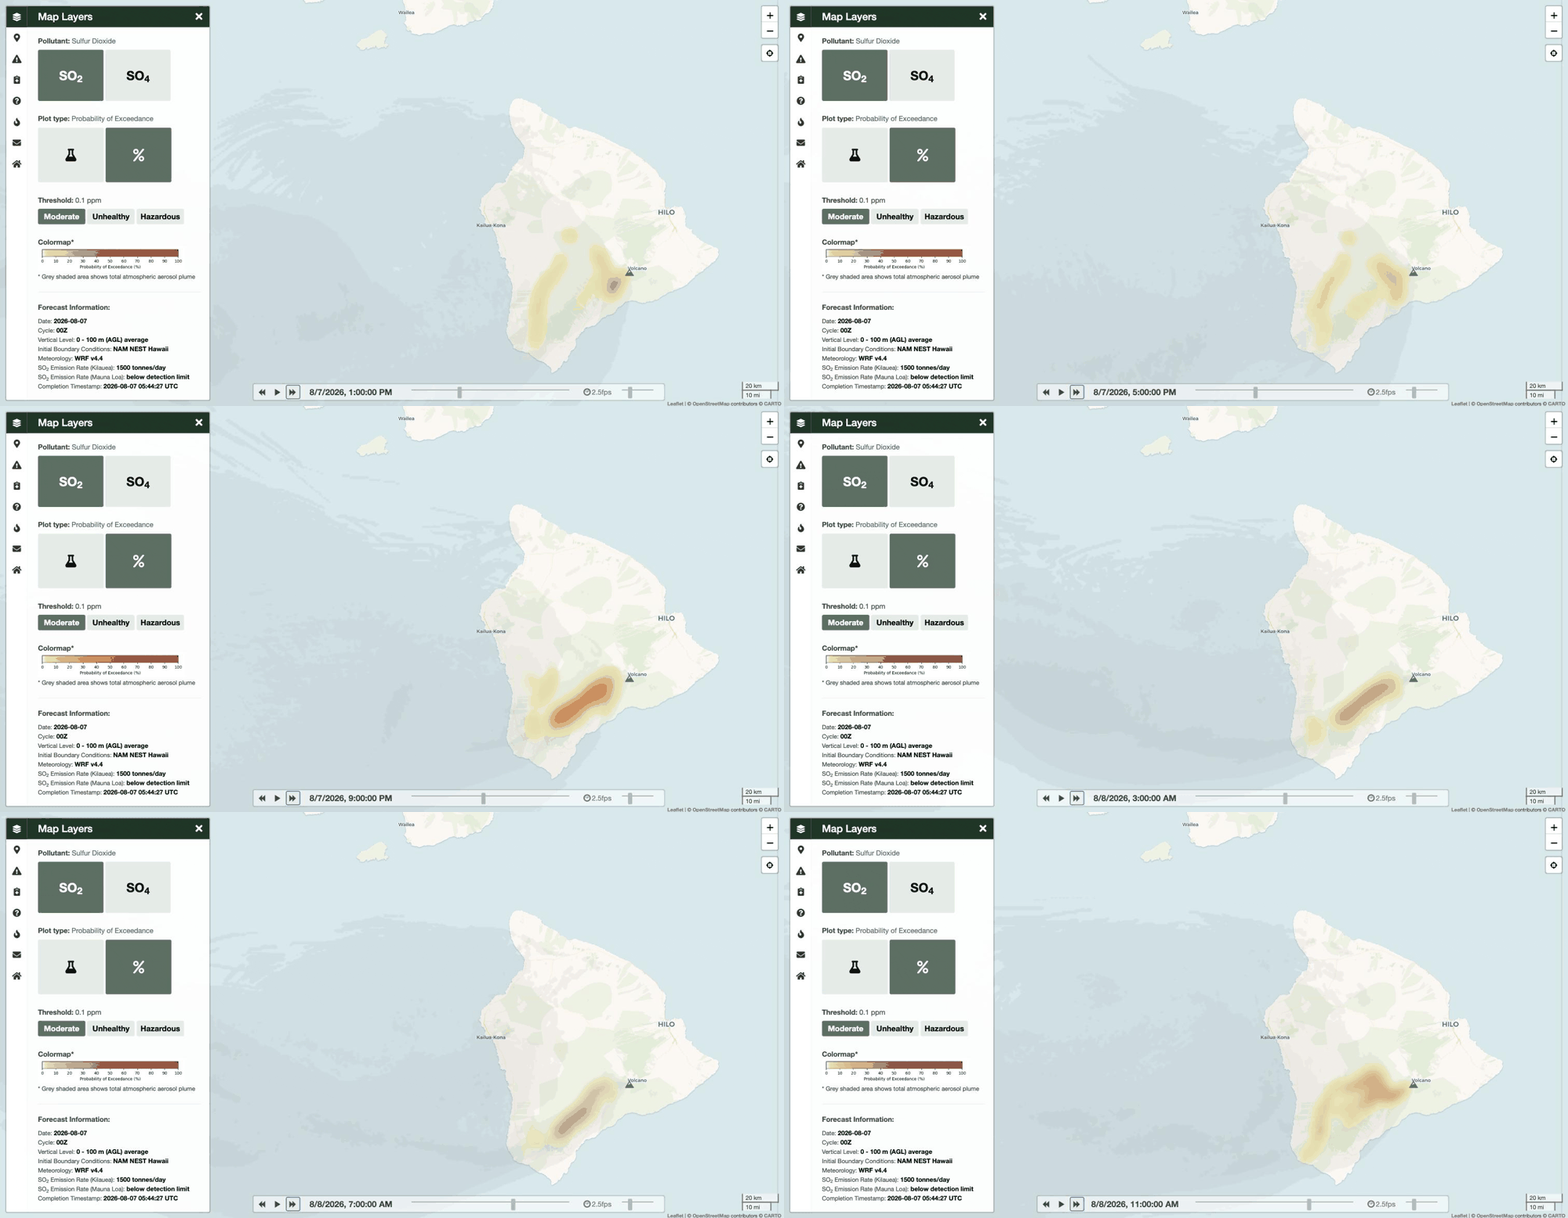
A 24-hour vog forecast for the Big Island, from the University of Hawāiʻi model run on August 7, 2026. Ground-level sulfur dioxide, the gas behind vog, pools over Kaʻū and the South Kona coast near Ocean View overnight, then thins by mid-morning, while Kailua-Kona and the windward Hilo side stay clear. On the leeward south side, mornings are the cleaner window, and the picture shifts day to day, so check the live map before you go. Source: University of Hawāiʻi VMAP.
Where to check current vog conditions
Vog shifts day to day with the eruption and the wind, so there is no fixed map of it. Before a Kaʻū, Volcano, or Kona visit, check the live sources:
- The Hawaiʻi Interagency Vog Dashboard: the vog forecast and current conditions, run jointly by the state Health Department, USGS, and the National Weather Service.
- The Hawaiʻi SO₂ Index: live sulfur-dioxide monitor readings on a green-through-maroon health scale.
- The USGS Hawaiian Volcano Observatory: current eruption status and gas-emission rate, updated daily.
- For the park itself, Hawaiʻi Volcanoes National Park’s weather and air-quality page: conditions and closures on the summit and Kaʻū side.
Sources and methods
- Station rainfall and temperature: NOAA 1991 to 2020 climate normals and the UH Rainfall Atlas of Hawaiʻi (1978 to 2007), each named where used. Extremes drawn only from well-observed stations.
- Island rainfall, temperature, and cloud maps: University of Hawaiʻi 250-metre grids (Giambelluca et al. 2013, 2014), draped over USGS 3DEP terrain.
- Beach-weather map: each beach rated on the UH 250-metre rainfall and cloud grids above, with the best time of day from the hour-by-hour cloud grid; base relief from the Terrarium DEM (SRTM/3DEP), roads © OpenStreetMap.
- Snow, summits, and the inversion: NWS Honolulu, UH Hilo Maunakea stewardship, and the 1983 Atlas of Hawaiʻi climate chapter (Saul Price).
- Vog and SO₂: USGS Hawaiian Volcano Observatory and the Hawaiʻi interagency vog dashboard (DOH / USGS / NWS).
- Explore the data yourself: the UH Hawaiʻi Climate Data Portal publishes interactive climate maps, live readings from the Hawaiʻi Mesonet station network (live data), and monthly climate summaries.
Maps and charts on this page are made by Love Big Island from the public datasets above. Averages are long-term normals: a given day can and will run above or below them.